dashdot
 dashdot copied to clipboard
[Bug] Storage information not accurate on ZFS RAID
Description of the bug
Hello, for some reason my ZFS pool (composed of 2 drives) is not detected at all, and the interface shows the 2 raid drives as empty. I would expect to see 1 drive instead, showing the total used space, along with something like "zfs pool" or "raid" written.
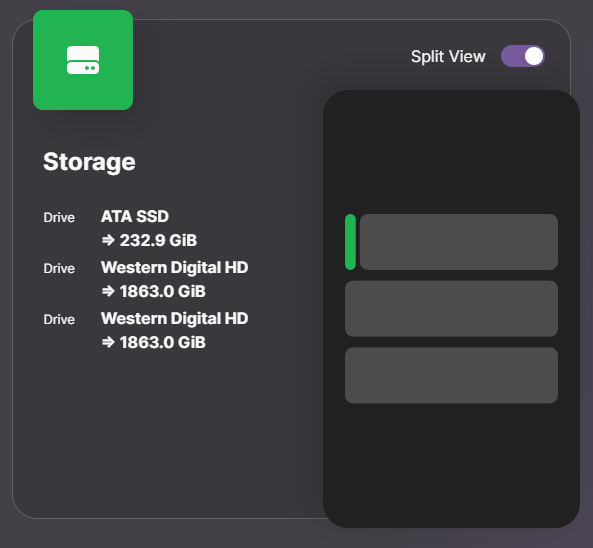
On the picture above, the first drive is where the os is installed : there is nothing wrong with this one.
Is there a mistake in my config or something I have overlooked ? More info below:
docker exec -t CONTAINER df -kPT outputs:
Filesystem           Type       1024-blocks    Used Available Capacity Mounted on
overlay              overlay    238169856  16634912 209363784   7% /
tmpfs                tmpfs          65536         0     65536   0% /dev
shm                  tmpfs          65536         0     65536   0% /dev/shm
/dev/sda2            ext4       238169856  16634912 209363784   7% /mnt/host
udev                 devtmpfs     8032108         0   8032108   0% /mnt/host/dev
tmpfs                tmpfs        8090464         0   8090464   0% /mnt/host/dev/shm
tmpfs                tmpfs        1618096      2004   1616092   0% /mnt/host/run
tmpfs                tmpfs           5120         0      5120   0% /mnt/host/run/lock
tmpfs                tmpfs        1618096      2004   1616092   0% /mnt/host/run/snapd/ns
tmpfs                tmpfs        1618092         4   1618088   0% /mnt/host/run/user/1000
/dev/sda1            vfat         1098628      6216   1092412   1% /mnt/host/boot/efi
pool_0               zfs        1243298688       128 1243298560   0% /mnt/host/mnt/pool_0
pool_0/media         zfs        1747019264 503720704 1243298560  29% /mnt/host/mnt/pool_0/media
pool_0/cloud         zfs        1382140288 138841728 1243298560  10% /mnt/host/mnt/pool_0/cloud
/dev/loop0           squashfs       56960     56960         0 100% /mnt/host/snap/core18/2721
/dev/loop1           squashfs       64896     64896         0 100% /mnt/host/snap/core20/1822
/dev/loop2           squashfs       64896     64896         0 100% /mnt/host/snap/core20/1852
/dev/loop3           squashfs      114688    114688         0 100% /mnt/host/snap/lxd/24322
/dev/loop4           squashfs       51072     51072         0 100% /mnt/host/snap/snapd/18357
/dev/loop5           squashfs       54528     54528         0 100% /mnt/host/snap/snapd/18933
overlay              overlay    238169856  16634908 209363788   7% /mnt/host/var/lib/docker/overlay2/79b9202a99396f0bfabddeec5805ec09b9a150c5bd8d63e21878cfe3e96e54e9/merged
overlay              overlay    238169856  16634908 209363788   7% /mnt/host/var/lib/docker/overlay2/d7696b0c7d11578c245e197c7061abde1dde04553a61576e29db213f08ebfc91/merged
overlay              overlay    238169856  16634908 209363788   7% /mnt/host/var/lib/docker/overlay2/c8b7ec3b45f441b77748d9a1f1c460e61bd831cba967990eb9a6a7efc6bf32da/merged
overlay              overlay    238169856  16634908 209363788   7% /mnt/host/var/lib/docker/overlay2/c7e4e21bf4dc9bf9e86599514afaa1b796c355b93a8573c63988634d0d3df8ab/merged
overlay              overlay    238169856  16634908 209363788   7% /mnt/host/var/lib/docker/overlay2/c7e4e21bf4dc9bf9e86599514afaa1b796c355b93a8573c63988634d0d3df8ab/merged
tmpfs                tmpfs          65536         0     65536   0% /mnt/host/var/lib/docker/overlay2/c7e4e21bf4dc9bf9e86599514afaa1b796c355b93a8573c63988634d0d3df8ab/merged/dev
shm                  tmpfs          65536         0     65536   0% /mnt/host/var/lib/docker/overlay2/c7e4e21bf4dc9bf9e86599514afaa1b796c355b93a8573c63988634d0d3df8ab/merged/dev/shm
/dev/sda2            ext4       238169856  16634908 209363788   7% /etc/resolv.conf
/dev/sda2            ext4       238169856  16634908 209363788   7% /etc/hostname
/dev/sda2            ext4       238169856  16634908 209363788   7% /etc/hosts
Pool_0 is reported as empty here, but I have read somewhere that it was a limit of the df command and is expected.
Running the same command on the host gives:
Filesystem     Type  1024-blocks      Used  Available Capacity Mounted on
tmpfs          tmpfs     1618096      2000    1616096       1% /run
/dev/sda2      ext4    238169856  16634932  209363764       8% /
tmpfs          tmpfs     8090464         0    8090464       0% /dev/shm
tmpfs          tmpfs        5120         0       5120       0% /run/lock
/dev/sda1      vfat      1098628      6216    1092412       1% /boot/efi
pool_0         zfs    1243298688       128 1243298560       1% /mnt/pool_0
pool_0/media   zfs    1747019264 503720704 1243298560      29% /mnt/pool_0/media
pool_0/cloud   zfs    1382140288 138841728 1243298560      11% /mnt/pool_0/cloud
tmpfs          tmpfs     1618092         4    1618088       1% /run/user/1000
And running zfs list on the host gives:
NAME           USED  AVAIL     REFER  MOUNTPOINT
pool_0         613G  1.16T       96K  /mnt/pool_0
pool_0/cloud   132G  1.16T      132G  /mnt/pool_0/cloud
pool_0/media   480G  1.16T      480G  /mnt/pool_0/media
My config is :
  dash:
    container_name: dash
    image: mauricenino/dashdot:latest
    restart: unless-stopped
    privileged: true
    # ports:
    #   - '${WEBUI_PORT_DASH:?err}:8080'
    volumes:
      - /:/mnt/host:ro
    environment:
      - DASHDOT_PORT=80
      - DASHDOT_ACCEPT_OOKLA_EULA=true
      - PUID=${PUID:?err}
      - PGID=${PGID:?err}
      - TZ=${TIMEZONE:?err}
    networks:
      - media-network
How to reproduce
Create a ZFS pool (using the zpool package) and launch dashdot
Relevant log output
Output:
const disks =  [
  {
    device: '/dev/sda',
    type: 'SSD',
    name: 'CT250MX500SSD1  ',
    vendor: 'ATA',
    size: 250059350016,
    bytesPerSector: null,
    totalCylinders: null,
    totalHeads: null,
    totalSectors: null,
    totalTracks: null,
    tracksPerCylinder: null,
    sectorsPerTrack: null,
    firmwareRevision: '045',
    serialNum: '',
    interfaceType: 'SATA',
    smartStatus: 'unknown',
    temperature: null
  },
  {
    device: '/dev/sdb',
    type: 'HD',
    name: 'WDC WD20EARS-00M',
    vendor: 'Western Digital',
    size: 2000398934016,
    bytesPerSector: null,
    totalCylinders: null,
    totalHeads: null,
    totalSectors: null,
    totalTracks: null,
    tracksPerCylinder: null,
    sectorsPerTrack: null,
    firmwareRevision: 'AB51',
    serialNum: '',
    interfaceType: 'SATA',
    smartStatus: 'unknown',
    temperature: null
  },
  {
    device: '/dev/sdc',
    type: 'HD',
    name: 'WDC WD20EZRX-00D',
    vendor: 'Western Digital',
    size: 2000398934016,
    bytesPerSector: null,
    totalCylinders: null,
    totalHeads: null,
    totalSectors: null,
    totalTracks: null,
    tracksPerCylinder: null,
    sectorsPerTrack: null,
    firmwareRevision: '0A80',
    serialNum: '',
    interfaceType: 'SATA',
    smartStatus: 'unknown',
    temperature: null
  }
]
const sizes =  [
  {
    fs: 'overlay',
    type: 'overlay',
    size: 243885932544,
    used: 17034342400,
    available: 214388322304,
    use: 7.36,
    mount: '/',
    rw: false
  },
  {
    fs: '/dev/sda2',
    type: 'ext4',
    size: 243885932544,
    used: 17034342400,
    available: 214388322304,
    use: 7.36,
    mount: '/mnt/host',
    rw: true
  },
  {
    fs: '/dev/sda1',
    type: 'vfat',
    size: 1124995072,
    used: 6365184,
    available: 1118629888,
    use: 0.57,
    mount: '/mnt/host/boot/efi',
    rw: true
  },
  {
    fs: 'pool_0',
    type: 'zfs',
    size: 1273137856512,
    used: 131072,
    available: 1273137725440,
    use: 0,
    mount: '/mnt/host/mnt/pool_0',
    rw: false
  },
  {
    fs: 'pool_0/media',
    type: 'zfs',
    size: 1788947726336,
    used: 515810000896,
    available: 1273137725440,
    use: 28.83,
    mount: '/mnt/host/mnt/pool_0/media',
    rw: false
  },
  {
    fs: 'pool_0/cloud',
    type: 'zfs',
    size: 1415311654912,
    used: 142173929472,
    available: 1273137725440,
    use: 10.05,
    mount: '/mnt/host/mnt/pool_0/cloud',
    rw: false
  },
  {
    fs: '/dev/loop0',
    type: 'squashfs',
    size: 58327040,
    used: 58327040,
    available: 0,
    use: 100,
    mount: '/mnt/host/snap/core18/2721',
    rw: false
  },
  {
    fs: '/dev/loop1',
    type: 'squashfs',
    size: 66453504,
    used: 66453504,
    available: 0,
    use: 100,
    mount: '/mnt/host/snap/core20/1822',
    rw: false
  },
  {
    fs: '/dev/loop2',
    type: 'squashfs',
    size: 66453504,
    used: 66453504,
    available: 0,
    use: 100,
    mount: '/mnt/host/snap/core20/1852',
    rw: false
  },
  {
    fs: '/dev/loop3',
    type: 'squashfs',
    size: 117440512,
    used: 117440512,
    available: 0,
    use: 100,
    mount: '/mnt/host/snap/lxd/24322',
    rw: false
  },
  {
    fs: '/dev/loop4',
    type: 'squashfs',
    size: 52297728,
    used: 52297728,
    available: 0,
    use: 100,
    mount: '/mnt/host/snap/snapd/18357',
    rw: false
  },
  {
    fs: '/dev/loop5',
    type: 'squashfs',
    size: 55836672,
    used: 55836672,
    available: 0,
    use: 100,
    mount: '/mnt/host/snap/snapd/18933',
    rw: false
  }
]
const blocks =  [
  {
    name: 'sda',
    type: 'disk',
    fsType: '',
    mount: '',
    size: 250059350016,
    physical: 'SSD',
    uuid: '',
    label: '',
    model: 'CT250MX500SSD1',
    serial: '',
    removable: false,
    protocol: 'sata',
    group: '',
    device: '/dev/sda'
  },
  {
    name: 'sdb',
    type: 'disk',
    fsType: '',
    mount: '',
    size: 2000398934016,
    physical: 'HDD',
    uuid: '',
    label: '',
    model: 'WDC WD20EARS-00M',
    serial: '',
    removable: false,
    protocol: 'sata',
    group: '',
    device: '/dev/sdb'
  },
  {
    name: 'sdc',
    type: 'disk',
    fsType: '',
    mount: '',
    size: 2000398934016,
    physical: 'HDD',
    uuid: '',
    label: '',
    model: 'WDC WD20EZRX-00D',
    serial: '',
    removable: false,
    protocol: 'sata',
    group: '',
    device: '/dev/sdc'
  },
  {
    name: 'loop0',
    type: 'loop',
    fsType: 'squashfs',
    mount: '/mnt/host/snap/core18/2721',
    size: 58314752,
    physical: '',
    uuid: '',
    label: '',
    model: '',
    serial: '',
    removable: false,
    protocol: '',
    group: ''
  },
  {
    name: 'loop1',
    type: 'loop',
    fsType: 'squashfs',
    mount: '/mnt/host/snap/core20/1822',
    size: 66355200,
    physical: '',
    uuid: '',
    label: '',
    model: '',
    serial: '',
    removable: false,
    protocol: '',
    group: ''
  },
  {
    name: 'loop2',
    type: 'loop',
    fsType: 'squashfs',
    mount: '/mnt/host/snap/core20/1852',
    size: 66392064,
    physical: '',
    uuid: '',
    label: '',
    model: '',
    serial: '',
    removable: false,
    protocol: '',
    group: ''
  },
  {
    name: 'loop3',
    type: 'loop',
    fsType: 'squashfs',
    mount: '/mnt/host/snap/lxd/24322',
    size: 117387264,
    physical: '',
    uuid: '',
    label: '',
    model: '',
    serial: '',
    removable: false,
    protocol: '',
    group: ''
  },
  {
    name: 'loop4',
    type: 'loop',
    fsType: 'squashfs',
    mount: '/mnt/host/snap/snapd/18357',
    size: 52260864,
    physical: '',
    uuid: '',
    label: '',
    model: '',
    serial: '',
    removable: false,
    protocol: '',
    group: ''
  },
  {
    name: 'loop5',
    type: 'loop',
    fsType: 'squashfs',
    mount: '/mnt/host/snap/snapd/18933',
    size: 55824384,
    physical: '',
    uuid: '',
    label: '',
    model: '',
    serial: '',
    removable: false,
    protocol: '',
    group: ''
  },
  {
    name: 'sda1',
    type: 'part',
    fsType: 'vfat',
    mount: '/mnt/host/boot/efi',
    size: 1127219200,
    physical: '',
    uuid: 'DF3A-A56B',
    label: '',
    model: '',
    serial: '',
    removable: false,
    protocol: '',
    group: '',
    device: '/dev/sda'
  },
  {
    name: 'sda2',
    type: 'part',
    fsType: 'ext4',
    mount: '/mnt/host',
    size: 248929845248,
    physical: '',
    uuid: '06cee887-96fb-4bc2-89e3-a5d6eabb444b',
    label: '',
    model: '',
    serial: '',
    removable: false,
    protocol: '',
    group: '',
    device: '/dev/sda'
  },
  {
    name: 'sdb1',
    type: 'part',
    fsType: 'zfs_member',
    mount: '',
    size: 2000389406720,
    physical: '',
    uuid: '10083813909764366566',
    label: 'pool_0',
    model: '',
    serial: '',
    removable: false,
    protocol: '',
    group: '',
    device: '/dev/sdb'
  },
  {
    name: 'sdb9',
    type: 'part',
    fsType: '',
    mount: '',
    size: 8388608,
    physical: '',
    uuid: '',
    label: '',
    model: '',
    serial: '',
    removable: false,
    protocol: '',
    group: '',
    device: '/dev/sdb'
  },
  {
    name: 'sdc1',
    type: 'part',
    fsType: 'zfs_member',
    mount: '',
    size: 2000389406720,
    physical: '',
    uuid: '10083813909764366566',
    label: 'pool_0',
    model: '',
    serial: '',
    removable: false,
    protocol: '',
    group: '',
    device: '/dev/sdc'
  },
  {
    name: 'sdc9',
    type: 'part',
    fsType: '',
    mount: '',
    size: 8388608,
    physical: '',
    uuid: '',
    label: '',
    model: '',
    serial: '',
    removable: false,
    protocol: '',
    group: '',
    device: '/dev/sdc'
  }
]
Info output of dashdot cli
$ node dist/apps/cli/main.js info
INFO
=========
Yarn: 1.22.19
Node: v18.15.0
Dash: 5.1.3

Cwd: /app
Hash: 386191c474baca48d35d655bf77a8b4953e8645b
In Docker: true
In Podman: false
In Docker (env): true
Done in 0.28s.
What browsers are you seeing the problem on?
Chrome
Where is your instance running?
Linux Server
Additional context
The network and port part of my config may be confusing : this is because I am running dashdot with a reverse proxy container
Thanks for creating an issue. What RAID type is this running in?
Also, is there any way to get the current RAID type programmatically (through a CLI command) in ZFS?
I am not really sure how docker runs under the hood, but on linux this could work :
Once the name of the zfs pool is known (here it is pool_0, as can be seen in df -kPT), one can run zpool list -v pool_0. This outputs:
NAME        SIZE  ALLOC   FREE  CKPOINT  EXPANDSZ   FRAG    CAP  DEDUP    HEALTH  ALTROOT
pool_0     1.81T   726G  1.10T        -         -     0%    39%  1.00x    ONLINE  -
  mirror-0  1.81T   726G  1.10T        -         -     0%  39.1%      -    ONLINE
    sdb        -      -      -        -         -      -      -      -    ONLINE
    sdc        -      -      -        -         -      -      -      -    ONLINE
We can see here that the type is mirror followed by the group id 0 (not sure what this mean though). We can also see that sdb and sdc are dedicated to this pool, and should therefore not be displayed as separate drives.
Alternatively, tunning zpool list -vH pool_0 gives an easier to parse output, separated by tabs and spaces:
pool_0  1.81T   726G    1.10T   -       -       0%      39%     1.00x   ONLINE  -
        mirror-0        1.81T   726G    1.10T   -       -       0%      39.1%   -       ONLINE
        sdb     -       -       -       -       -       -       -       -       ONLINE
        sdc     -       -       -       -       -       -       -       -       ONLINE
reading the particular value is out of my skill range, but it should be feasible without too much hassle I guess. The arguments of the command can be found here.
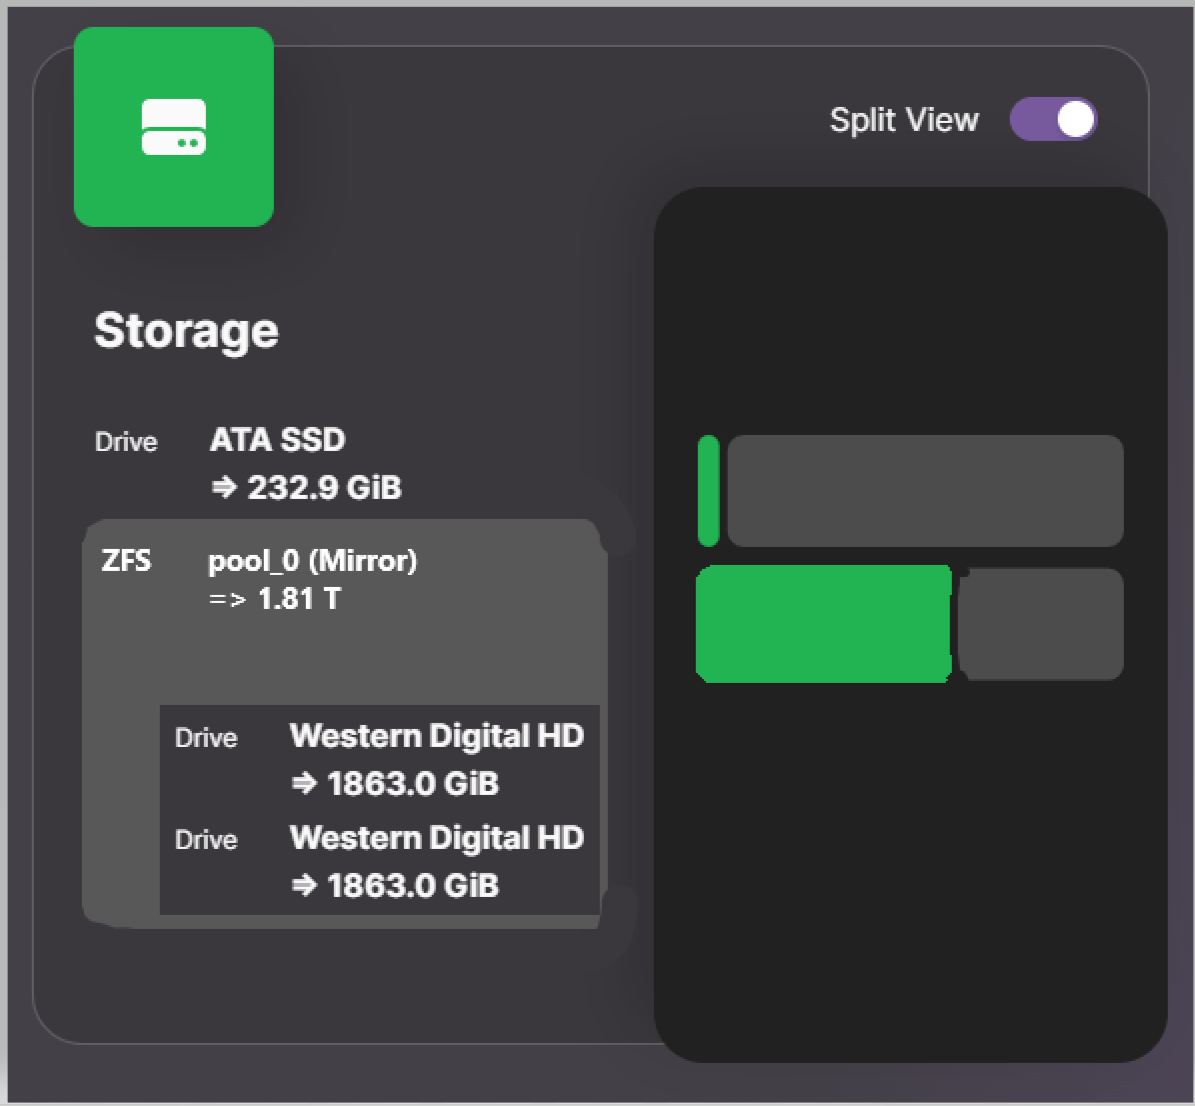
Given the versatile nature of Zpools, I think the best way to display that would be to consider each pool as a separate volume. The type of the pool could be diplayed next to the pool name, and the drives used for the pool listed underneath, as shown in the concept below.
What I am not understanding is - what is the real size of this pool? 1.8TB or 3.6TB? And what is the current usage you are seeing (in case it didn't really change since you opened this issue).
For the widget that would not be a problem, I already support RAID drives, I just need to know how I should parse what systeminformation is giving me.
So, what to do with those values (especially the sizes array needs to be interpreted correctly to get the current usage of the zfs pool):
const disks =  [
  {
    device: '/dev/sdb',
    type: 'HD',
    name: 'WDC WD20EARS-00M',
    vendor: 'Western Digital',
    size: 2000398934016,
    bytesPerSector: null,
    totalCylinders: null,
    totalHeads: null,
    totalSectors: null,
    totalTracks: null,
    tracksPerCylinder: null,
    sectorsPerTrack: null,
    firmwareRevision: 'AB51',
    serialNum: '',
    interfaceType: 'SATA',
    smartStatus: 'unknown',
    temperature: null
  },
  {
    device: '/dev/sdc',
    type: 'HD',
    name: 'WDC WD20EZRX-00D',
    vendor: 'Western Digital',
    size: 2000398934016,
    bytesPerSector: null,
    totalCylinders: null,
    totalHeads: null,
    totalSectors: null,
    totalTracks: null,
    tracksPerCylinder: null,
    sectorsPerTrack: null,
    firmwareRevision: '0A80',
    serialNum: '',
    interfaceType: 'SATA',
    smartStatus: 'unknown',
    temperature: null
  }
]
const sizes =  [
  {
    fs: 'pool_0',
    type: 'zfs',
    size: 1273137856512,
    used: 131072,
    available: 1273137725440,
    use: 0,
    mount: '/mnt/host/mnt/pool_0',
    rw: false
  },
  {
    fs: 'pool_0/media',
    type: 'zfs',
    size: 1788947726336,
    used: 515810000896,
    available: 1273137725440,
    use: 28.83,
    mount: '/mnt/host/mnt/pool_0/media',
    rw: false
  },
  {
    fs: 'pool_0/cloud',
    type: 'zfs',
    size: 1415311654912,
    used: 142173929472,
    available: 1273137725440,
    use: 10.05,
    mount: '/mnt/host/mnt/pool_0/cloud',
    rw: false
  }
]
const blocks =  [
  {
    name: 'sdb',
    type: 'disk',
    fsType: '',
    mount: '',
    size: 2000398934016,
    physical: 'HDD',
    uuid: '',
    label: '',
    model: 'WDC WD20EARS-00M',
    serial: '',
    removable: false,
    protocol: 'sata',
    group: '',
    device: '/dev/sdb'
  },
  {
    name: 'sdc',
    type: 'disk',
    fsType: '',
    mount: '',
    size: 2000398934016,
    physical: 'HDD',
    uuid: '',
    label: '',
    model: 'WDC WD20EZRX-00D',
    serial: '',
    removable: false,
    protocol: 'sata',
    group: '',
    device: '/dev/sdc'
  },
  {
    name: 'sdb1',
    type: 'part',
    fsType: 'zfs_member',
    mount: '',
    size: 2000389406720,
    physical: '',
    uuid: '10083813909764366566',
    label: 'pool_0',
    model: '',
    serial: '',
    removable: false,
    protocol: '',
    group: '',
    device: '/dev/sdb'
  },
  {
    name: 'sdb9',
    type: 'part',
    fsType: '',
    mount: '',
    size: 8388608,
    physical: '',
    uuid: '',
    label: '',
    model: '',
    serial: '',
    removable: false,
    protocol: '',
    group: '',
    device: '/dev/sdb'
  },
  {
    name: 'sdc1',
    type: 'part',
    fsType: 'zfs_member',
    mount: '',
    size: 2000389406720,
    physical: '',
    uuid: '10083813909764366566',
    label: 'pool_0',
    model: '',
    serial: '',
    removable: false,
    protocol: '',
    group: '',
    device: '/dev/sdc'
  },
  {
    name: 'sdc9',
    type: 'part',
    fsType: '',
    mount: '',
    size: 8388608,
    physical: '',
    uuid: '',
    label: '',
    model: '',
    serial: '',
    removable: false,
    protocol: '',
    group: '',
    device: '/dev/sdc'
  }
]
So I have digged around a bit, and apparently the way it works is the following:
ZFS can manage to put different file systems into a single pool, and to dynamically allocate and deallocate space between them. In my case, pool_0 contains two dataframes called cloud and media, who act like partitions, but for which the size is not fixed and can dynamically change.
There are basically 3 ways to check to storage state.
zpool list gives accurate info on the pool but nothing on the dataframes :
NAME     SIZE  ALLOC   FREE  CKPOINT  EXPANDSZ   FRAG    CAP  DEDUP    HEALTH  ALTROOT
pool_0  1.81T   726G  1.10T        -         -     0%    39%  1.00x    ONLINE  -
zfs list gives info on the pools and dataframes :
NAME           USED  AVAIL     REFER  MOUNTPOINT
pool_0         726G  1.05T       96K  /mnt/pool_0
pool_0/cloud   133G  1.05T      133G  /mnt/pool_0/cloud
pool_0/media   593G  1.05T      593G  /mnt/pool_0/media
We can see that both cloud and media have 1.05T available, but the total available space is 1.05T (so the real size of the pool is 1.8T and not 3.6)
Finally, I guess that systeminformation is based on the df command which is not very adapted to ZFS. Running it gives:
Filesystem     Type  1024-blocks      Used  Available Capacity Mounted on
pool_0         zfs    1124437248       128 1124437120       1% /mnt/pool_0
pool_0/media   zfs    1746713472 622276352 1124437120      36% /mnt/pool_0/media
pool_0/cloud   zfs    1263583360 139146240 1124437120      12% /mnt/pool_0/cloud
This output is wrong in every way possible. As explained briefly here, df is unable to accurately read infos on zfs, and the reported usage can even change although the pool is inactive.
I think that the (current) output of systeminformation is not enough to accurately read the disk usage. I am not really sure if I should open an issue there, or if this is beyond the scope of the repo
I have created an issue on the systeminformation repo for this (https://github.com/sebhildebrandt/systeminformation/issues/802).
Please provide any requested information in case @sebhildebrandt needs it to develop this feature.
If this can be successfully implemented, I will start my implementation in Dashdot right after!
Also, can you please post the output of the command that gives the most information about the pool?
What I am after would be: disks in pool, size, usage, mounts.
I am not sure, as I don't have a running ZFS pool, but it seems like this would be the correct command.
zpool list -v -H -P
But please check for yourself, or post the output of the --help or similar.
Sure thing, this is what I get:
pool_0  1.81T   726G    1.10T   -       -       0%      39%     1.00x   ONLINE  -
        mirror-0        1.81T   726G    1.10T   -       -       0%      39.1%   -       ONLINE
        /dev/sdb1       -       -       -       -       -       -       -       -       ONLINE
        /dev/sdc1       -       -       -       -       -       -       -       -       ONLINE
By removing the -H option (so you can see what each value corresponds to) I get :
NAME            SIZE  ALLOC   FREE  CKPOINT  EXPANDSZ   FRAG    CAP  DEDUP    HEALTH  ALTROOT
pool_0         1.81T   726G  1.10T        -         -     0%    39%  1.00x    ONLINE  -
  mirror-0     1.81T   726G  1.10T        -         -     0%  39.1%      -    ONLINE
    /dev/sdb1      -      -      -        -         -      -      -      -    ONLINE
    /dev/sdc1      -      -      -        -         -      -      -      -    ONLINE
We cannot get the mount point if this what you are after, but df directly gives the mount point of the pool
pool_0  1.81T   726G    1.10T   -       -       0%      39%     1.00x   ONLINE  -
       mirror-0        1.81T   726G    1.10T   -       -       0%      39.1%   -       ONLINE
       /dev/sdb1       -       -       -       -       -       -       -       -       ONLINE
       /dev/sdc1       -       -       -       -       -       -       -       -       ONLINE
The first line looks to be less indented than the other ones. Is this on purpose, or by accident?
Also, could you maybe pipe it into a file, because I am not sure, but I think the separators are tabs, which would not be represented well in here.
zpool list -v -H -P -p > zpool_list_out.txt
And then upload that file to google drive, or our Discord server or anywhere where I can access it please.
Yes the separators do look like tabs and the first line indented separately. You can inspect the file here (Onedrive link)
Just as a note about Synology raid (btrfs). Space used for the raid is all allocated to the first disk. All disks appear in Dash as size 0 except for the first disk, which shows only as the disk size (not the size of the raid). So in my case, my "space used" was actually more than the "total space available". This was ok for me though, I just hid all the disks except the first one and then used an override to set the correct total space.
As a ZFS user, I'm more interested in the state of my pools than the underlying drives other than if zpool status says something is wrong with a drive.