activity-browser
 activity-browser copied to clipboard
Minor issues: displaying contribution results
Hi!
I've run into a couple of issues with the displaying of contribution analyses:
- Exporting plots of contributions either to .png or .svg does not work. It fails for the tabs "LCA Results", "EF Contributions" and "Process Contributions". It actually feels that the buttons are not linked to any command as nothing happens in the command lines.
- The "Aggregate by" function does not seem to work with the "database" option. When I select it, the contribution plot does not change and neither does the table.
- If I include too many processes in the contribution (reducing the cut-off criterion) the plot is completely shrunk because of the added space given to legend. A solution might be to allow the user to open the plot in a new window, or maybe to make the legend a scrollable item with a fixed width (although it would create trouble for screenshots I guess).
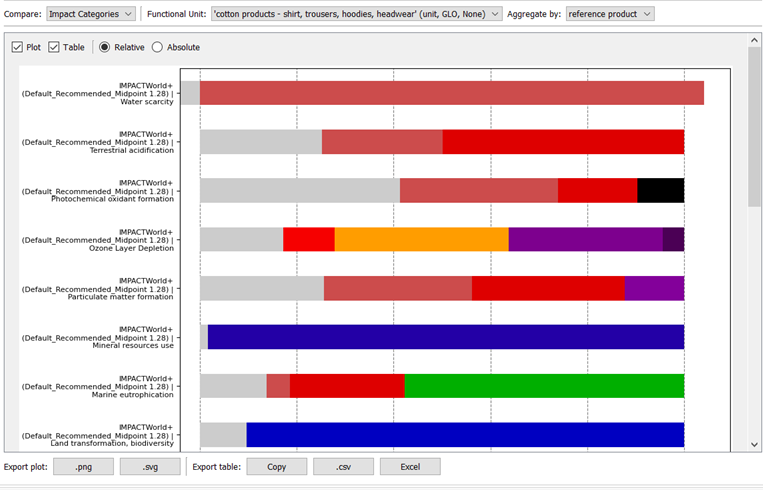
- If I compare impact categories for a given product (see screenshot below to see what I mean), the legend of the colors is not there so we do not have an idea which colors corresponds to which product.
I'm using AB 2.5.0. It's possible these issues have already been brought up, if that's the case I'm sorry.
Thanks for your work. AB is great. Stay safe!
@StpdFox , These issues dont exist after bokeh update. Issue can be closed once bokeh updates are merged with master.
Hi all, Is there any update about this topic? I'm encountering the same problem (AB version 2.8.0). Thanks!
Hi @MauraGit,
We've put in some fixes for the figure and table over the last months. Please update to the newest version and report back to us!
Kind regards,
Marin