Open-Assistant
 Open-Assistant copied to clipboard
Add netdata for infrastructure monitoring
[DRAFT PR] - needs discussion, just sharing this as a POC or example for other to try out and see.
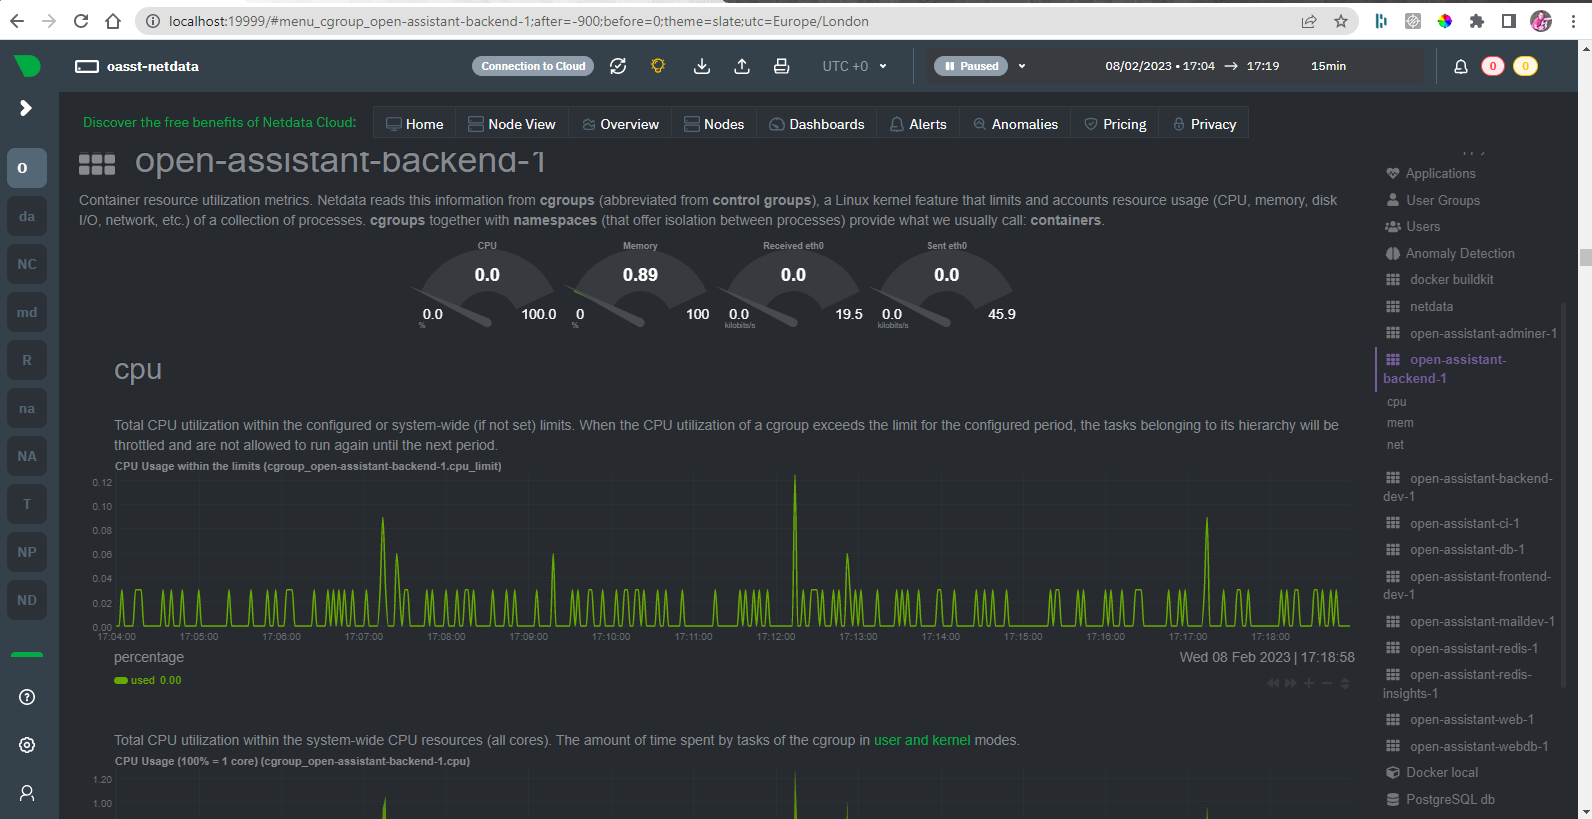
This PR adds a netdata monitoring agent running alongside the other containers.
End result being a local dashboard where you can see cpu, mem, net for each container:
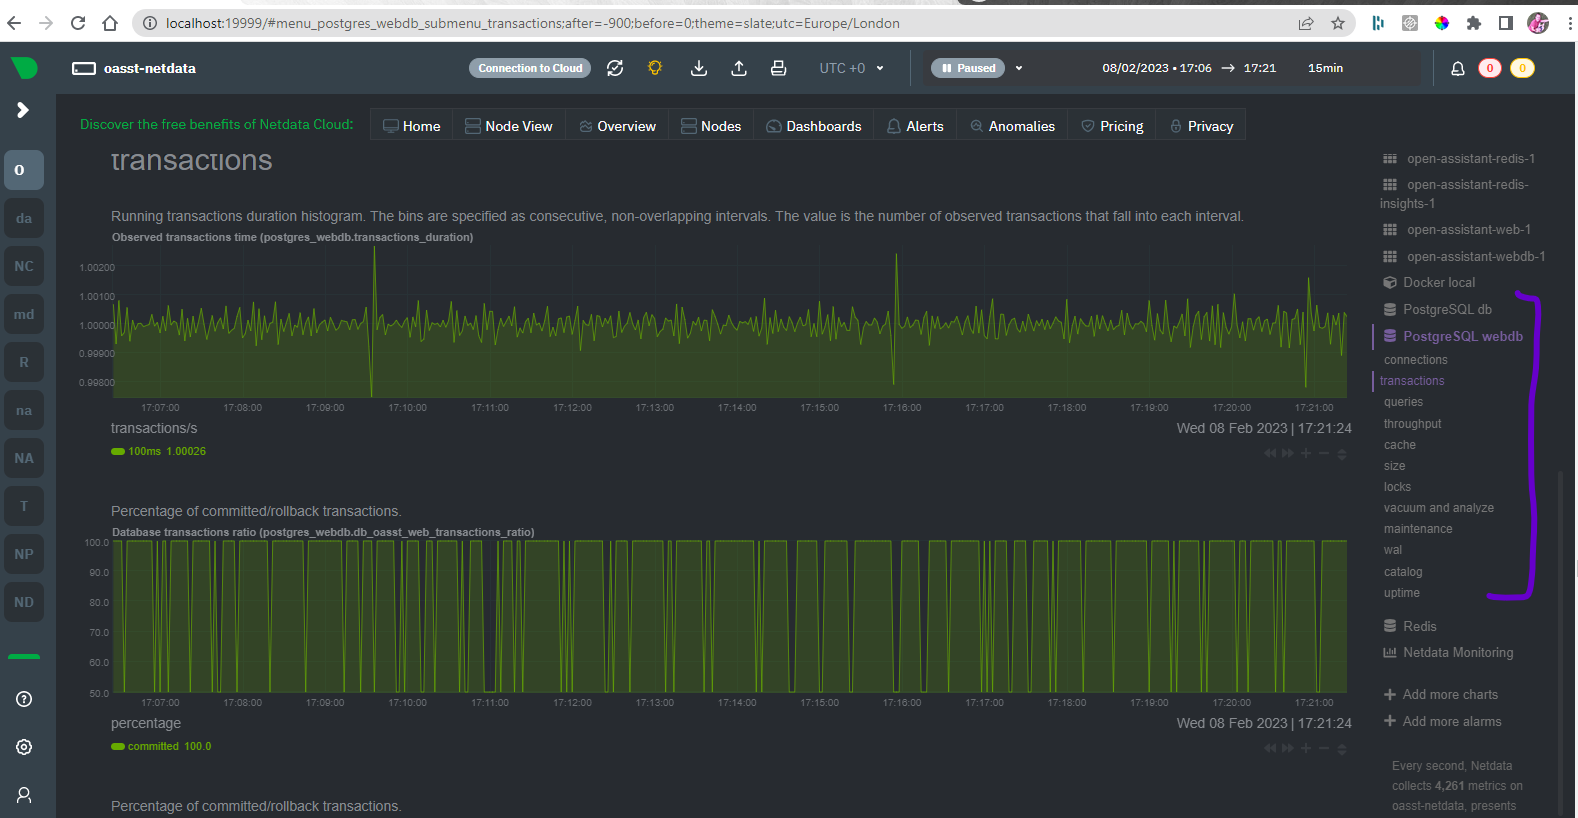
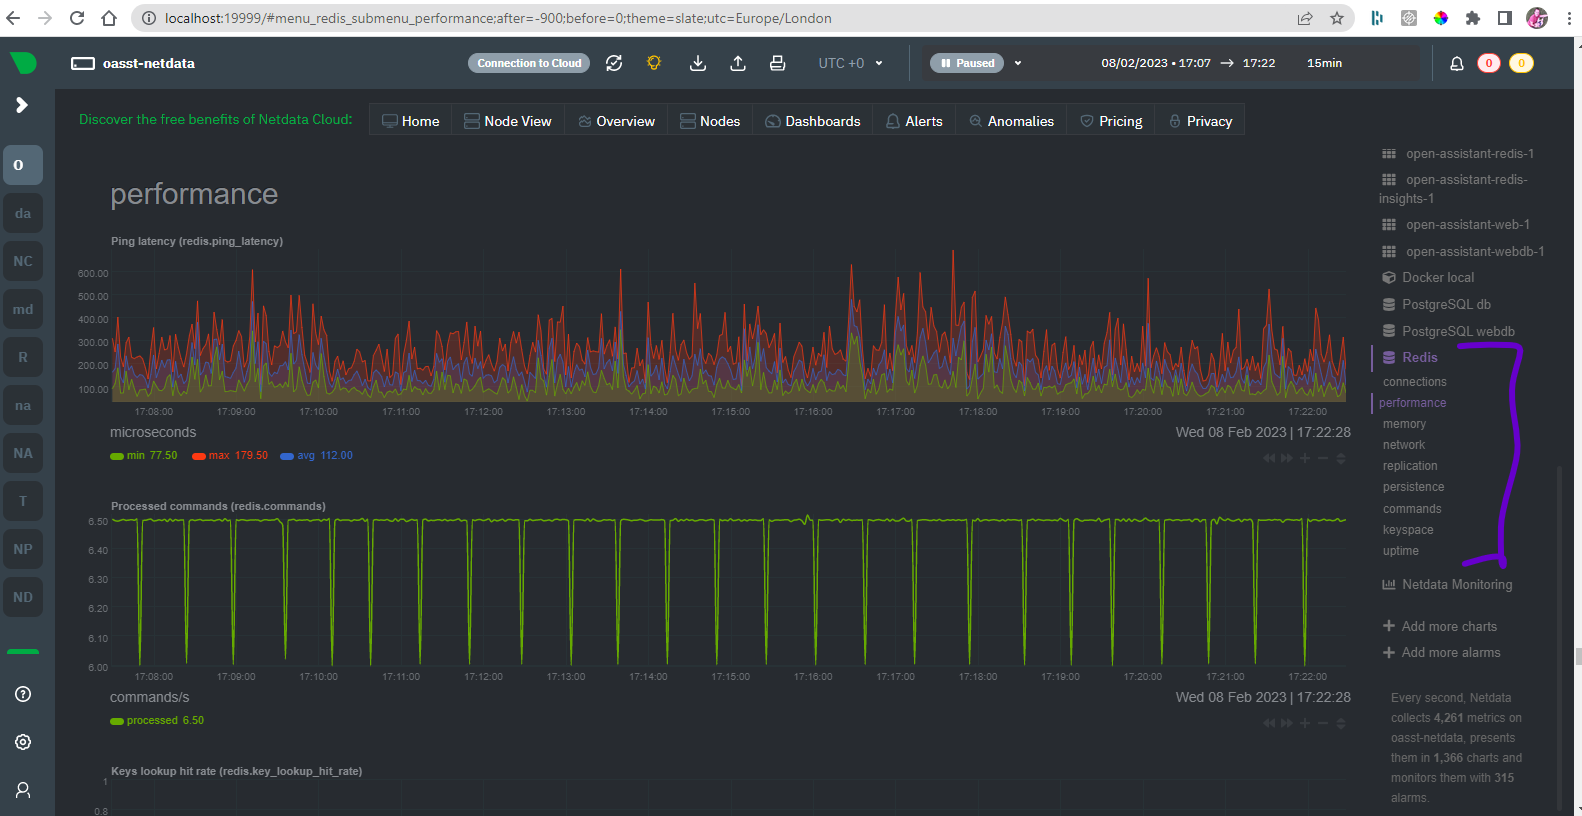
And also I have enabled redis and postgres collectors so that can see lots of redis and postgres stuff:
You can also claim the node to netdata cloud which is just a bit easier to work with and has some more features but that optional - can also just keep it running in local mode too.
Once open assistant is running you can run
docker compose up --build netdata
To turn on netdata and then at post 19999 would be the local netdata dashboard and charts.
This could be extended with more custom metrics using something like statsd or prometheus and could configure alerts to go to discord or email etc easy enough.
This looks cool. I'm tagging this as testing since it's reliability and introspection related
@andrewm4894 are you already member of our OA discord server? I created a new #docs channel .. if you join the server please ping me.
Since #1426 is merged i also configured netdata to scrape the Prometheus formatted /metrics endpoints of backend and inference-server.
This gives you charts like this - one for each Prometheus endpoint (inference server not running so not there) where can see counts by api endpoint etc:
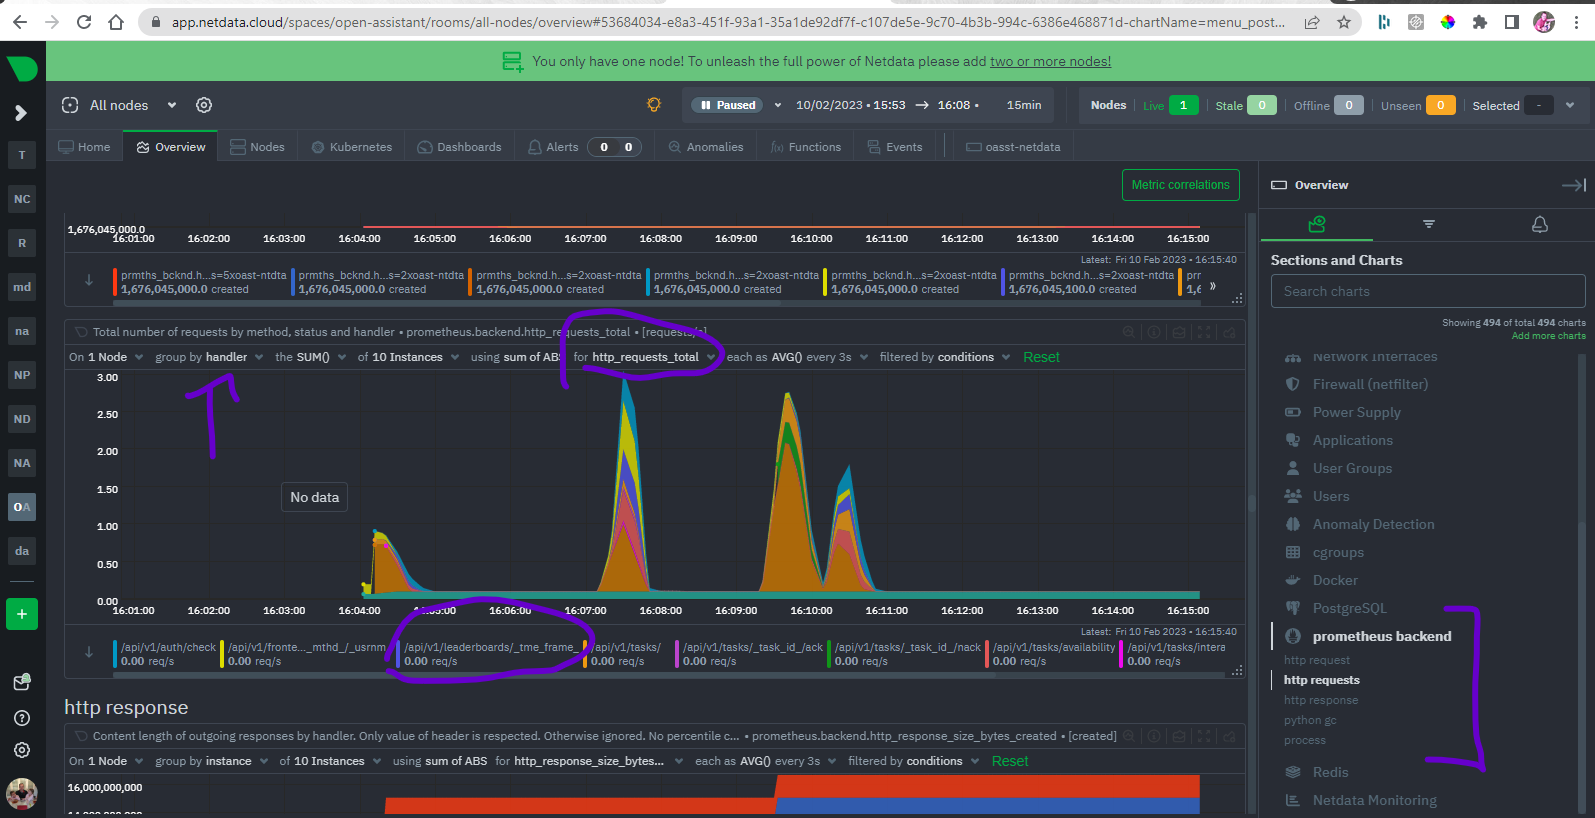
Probably would need to add a little more sort of processing logic to the prometheus.conf but mainly this just illustrates the flow.
Just wanna pipe up and say that this looks really cool! I wasn't aware of netdata but used Prometheus in the early days. Love it! :)
closing as done in https://github.com/LAION-AI/Open-Assistant/pull/1563