pygal

pygal copied to clipboard
Setting `x_label_rotation` > 0 decreases chart width
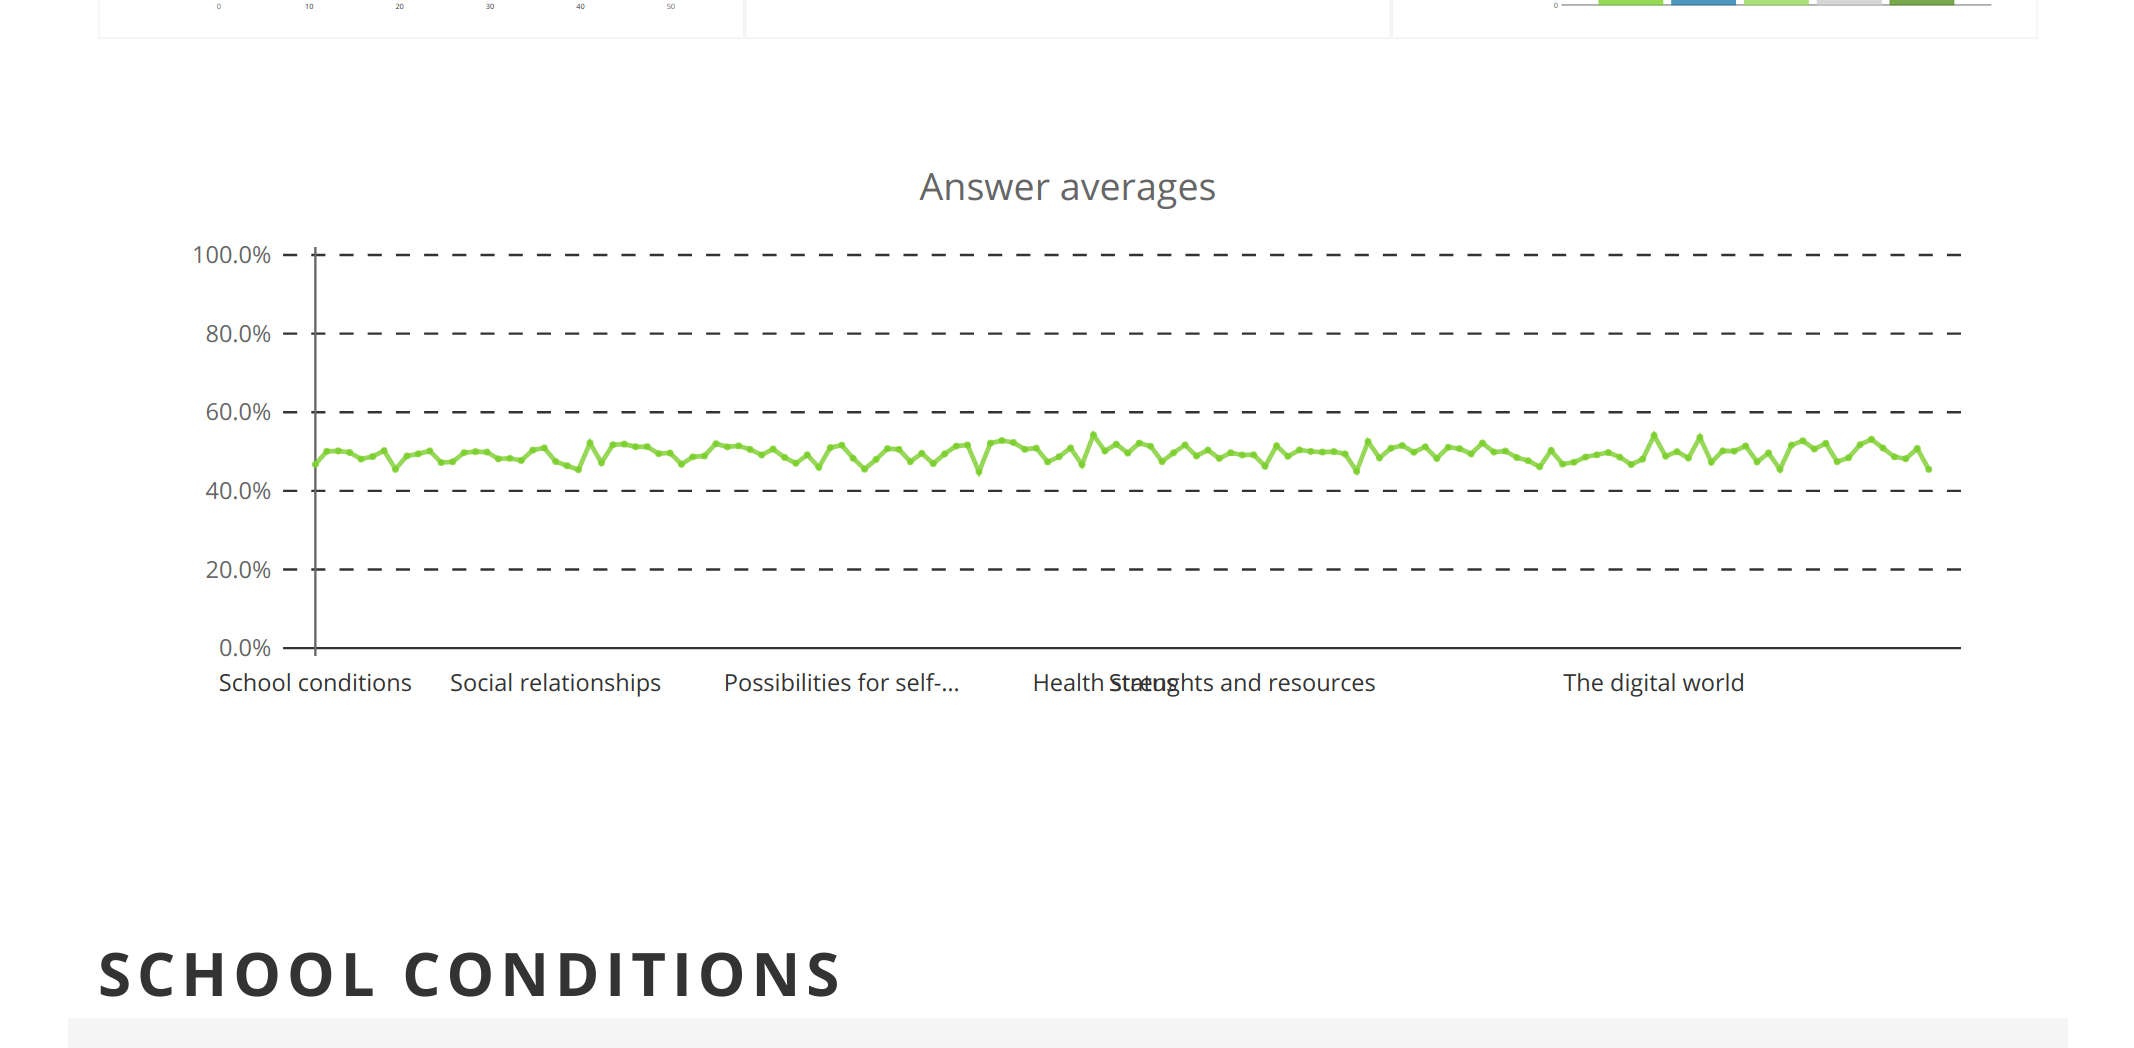
I'm drawing a simple Line chart that has 150 values. Most of the x_labels are set to None so that certain area limits within the graph are the only ones showing. With x_label_rotation set to 0 the graph displays correctly on a webpage with 100% width:
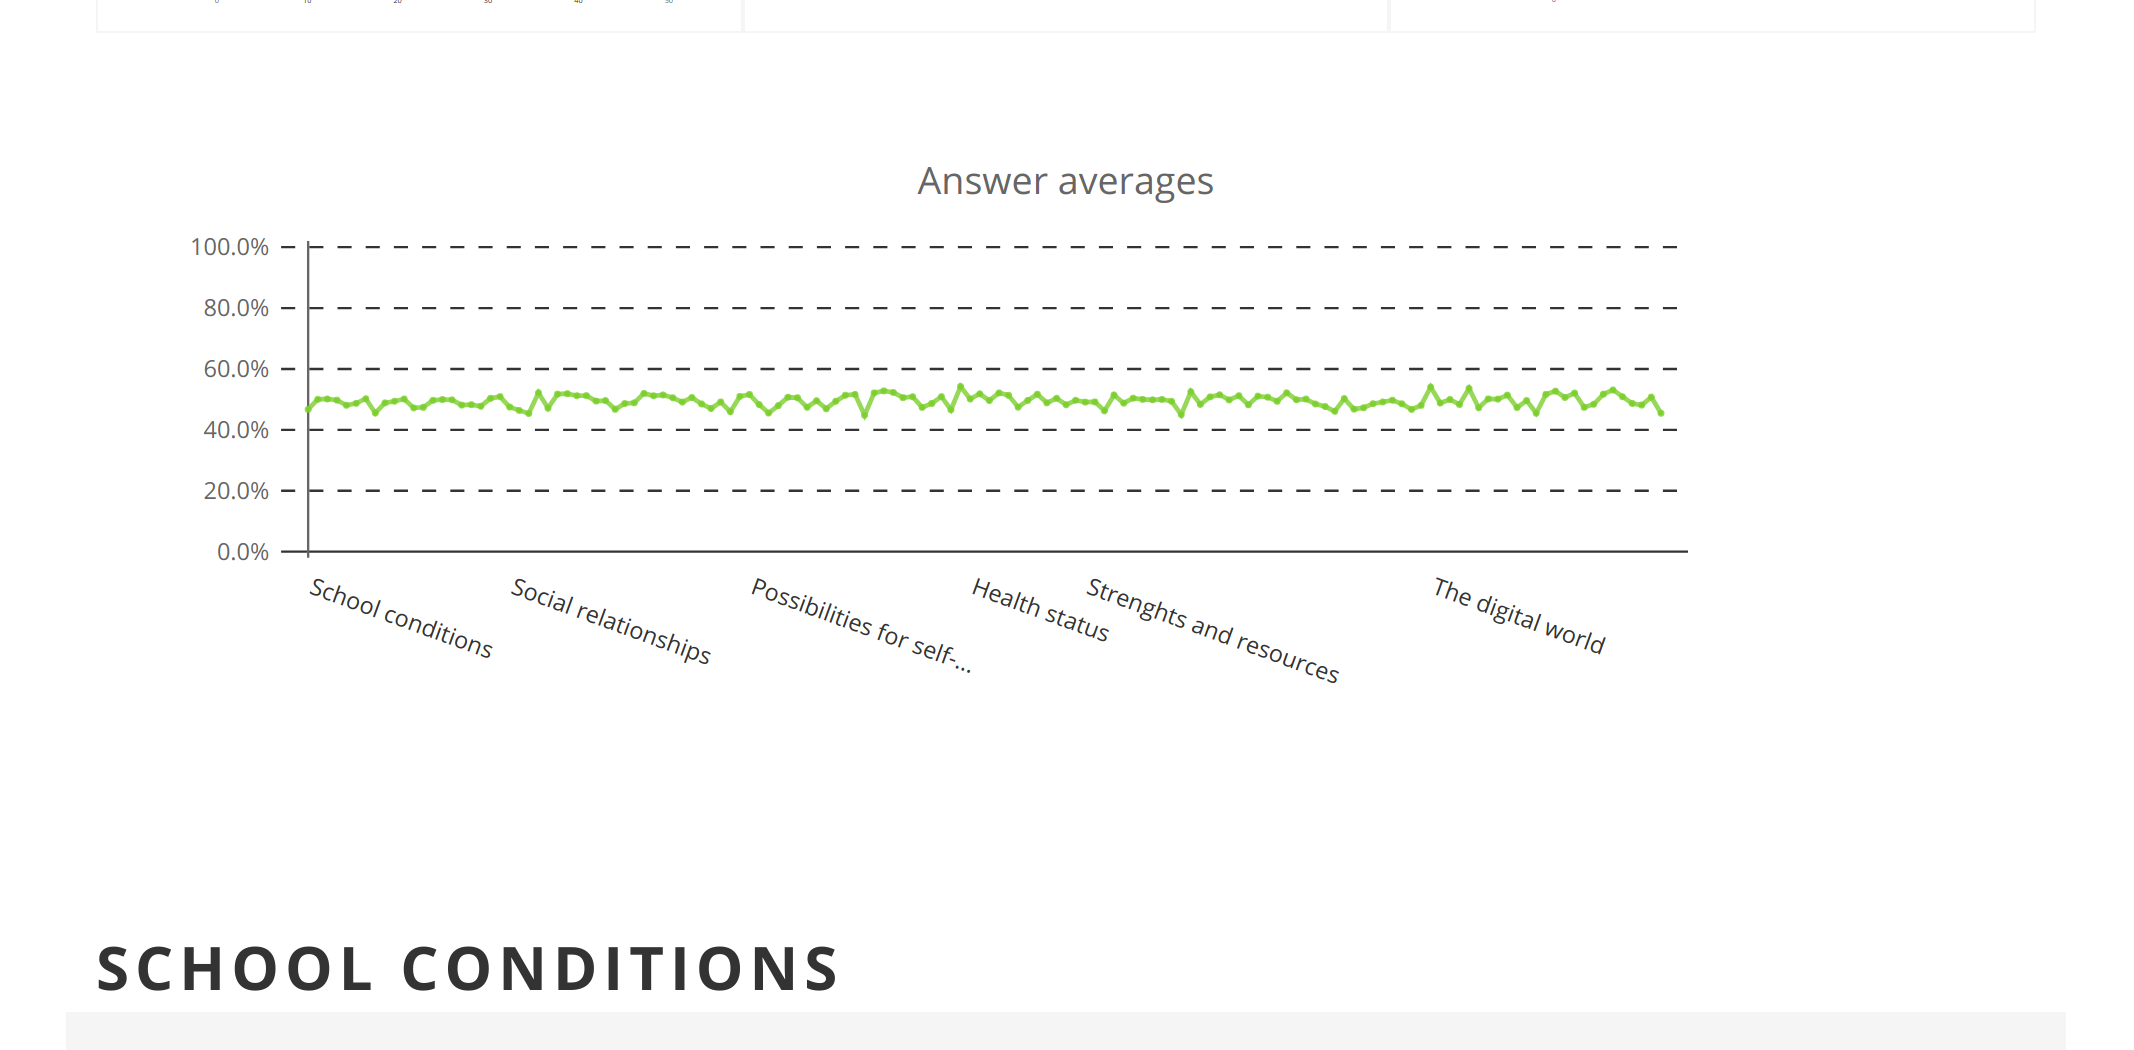
Changing the rotation to anything else, such as 20 will decrease the graph width:
Seems the rect.background gets a miscalculated width?