Kha
 Kha copied to clipboard
iOS Performance
Hi @RobDangerous.
As you may recall from chat and Github, I've been having performance issues on iOS.
While discussing in chat where the bottleneck might be, you said:
iPhone 5s is a dual core, guys. 50% activity means the thing is CPU bound.
Later, Antriel said:
50% of dual core = one core full. Which means you are bottlenecked, unless you do multithreading.
Obviously a CPU bottleneck is bad, so I started looking into why the CPU would be that high.
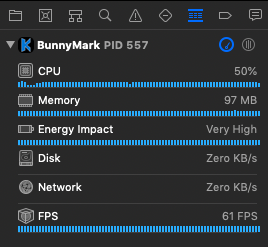
One strange thing I noticed is that my custom bunnymark build would be running at 50% CPU before any bunnies have even been added.
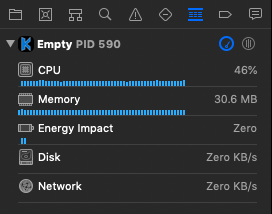
To get a better idea of how Kha should be running before adding extra stuff on top (like bunnymark), I tried the Empty build. To my surprise, it was running at 100% CPU out of the box. Not sure if that's expected behavior.
However, I remember @sh-dave saying you should draw to the framebuffer every frame, so I patched Empty as follows:
diff --git a/Sources/Main.hx b/Sources/Main.hx
index 3976b7f..0012af5 100644
--- a/Sources/Main.hx
+++ b/Sources/Main.hx
@@ -11,7 +11,8 @@ class Main {
        }

        static function render(framebuffer: Framebuffer): Void {
-
+               framebuffer.g2.begin(true, kha.Color.Black);
+               framebuffer.g2.end();
        }
That seems to have improved things a bit, as now the build only uses 46% CPU.
However, that's still nearly 50%, which means there isn't much room to run an app on top of Kha, at least on this device?
Not sure why, but while profiling the app, CPU usage hovers around 20%, but when running normally from Xcode, it uses 46% CPU.
Profiling and Running are both configured to compile as "release" builds.

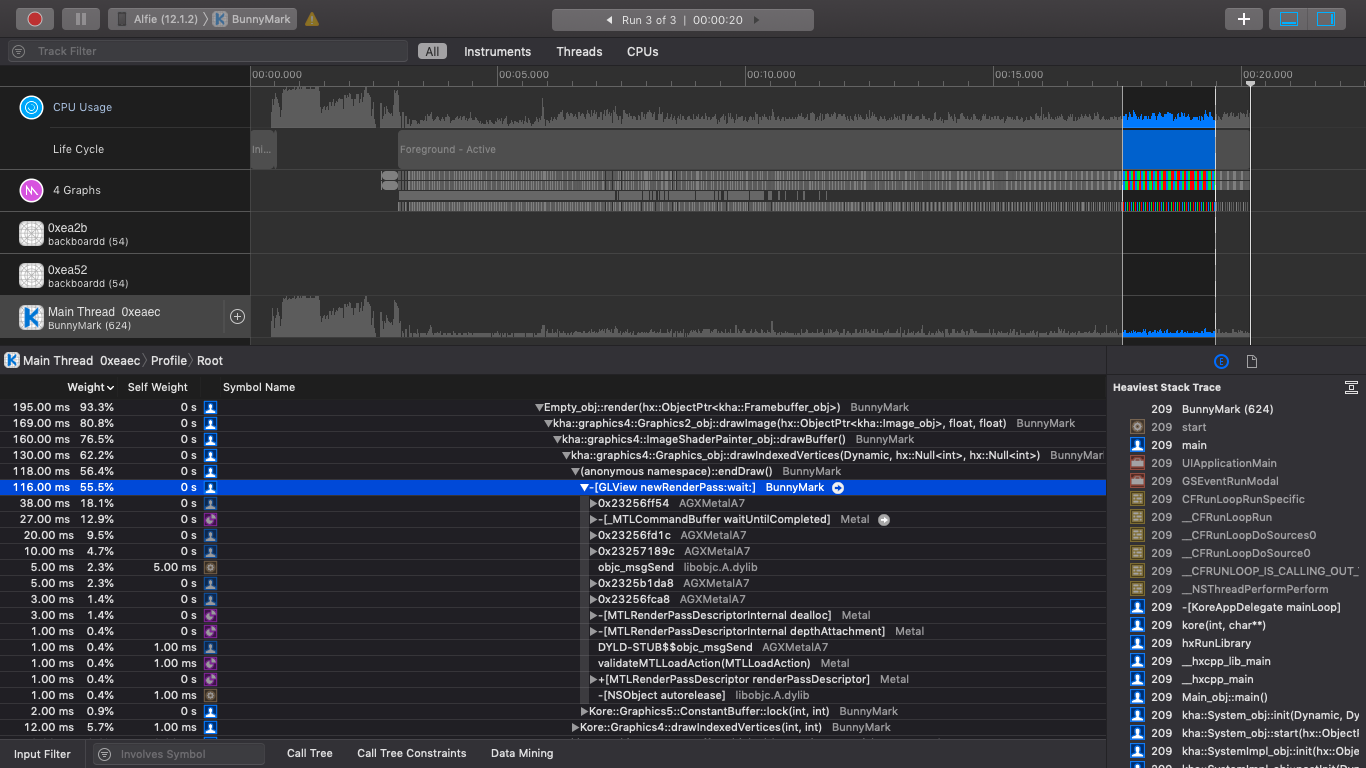
Nevertheless, here is what the profiling data shows:
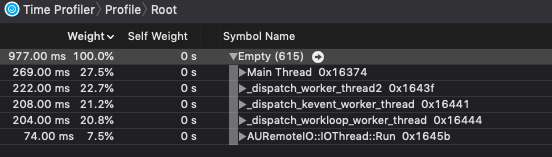
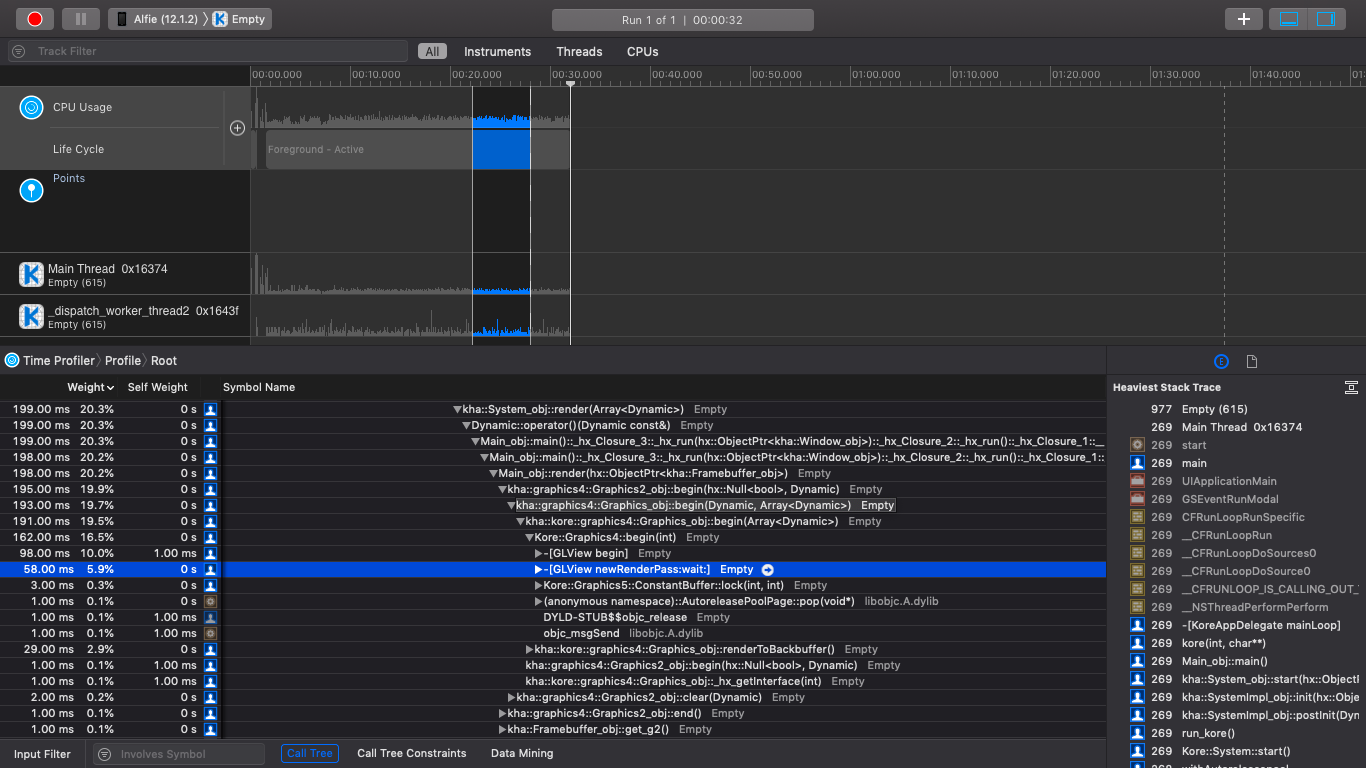
Looks like it's just waiting for vsync. Not very clever by Xcode to show that as CPU Usage but it's ok. Now show us profiling data from your game please.
Can we please stick to bunnymark (instead of my game)? Because I'm having performance issues in bunnymark too, and it seems like a simpler test case to work with.
Wanted to benchmark the iPhone in a "worst case" scenario, so I tweaked bunnymark to use a different texture for each bunny, and therefore bypass batching.
0 bunnies = 60 FPS 30 bunnies = 55 FPS 60 bunnies = 30 FPS
30 bunnies and already 60 FPS is not possible.
Yes, doesn't look good. Same data for Metal, OpenGL and Safari please (the bunny-fps numbers and the profiling data).
Metal:
0 bunnies = 60 FPS 30 bunnies = 55 FPS 60 bunnies = 30 FPS
OpenGL:
0 bunnies = 60 FPS 30 bunnies = 25 FPS 60 bunnies = 10 FPS
Safari:
0 bunnies = 60 FPS 30 bunnies = 57 FPS 60 bunnies = 31 FPS
Safari seems to be on par with Metal.
Thanks, that's useful data. Strange though as the OpenGL code is the same on all platforms and tends to beat the competition. Will spend some time with my iPad during the weekend.
@Joncom do you tested custom bunnymark bench with other platforms, like android-native/macos?
@RblSb
android-native (Samsung Galaxy S6):
0 bunnies = 60 FPS 30 bunnies = 60 FPS 60 bunnies = 60 FPS 150 bunnies = 60 FPS 170 bunnies = 55 FPS 200 bunnies = 40 FPS
OSX (MacBook Air, i7-4650U, 8 GB RAM):
0 bunnies = 60 FPS 30 bunnies = 60 FPS 60 bunnies = 60 FPS 300 bunnies = 60 FPS 350 bunnies = 50 FPS
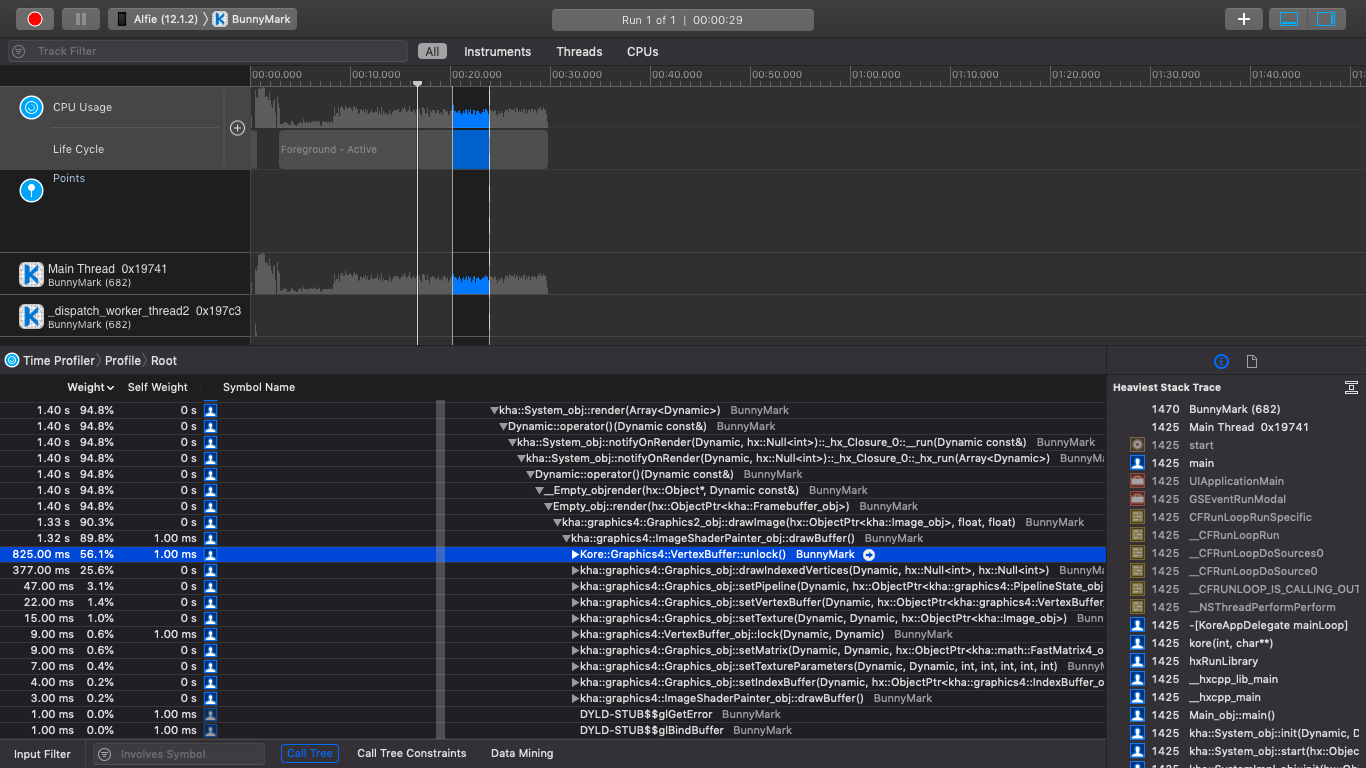
I think I found the cause and the fix is in https://github.com/Kode/Kha/commit/23029d14221f388c9b9e490831670aabd4098172 - still have to test on iOS and port to the different backends though.
Would testing iOS be as simple as checking out that “js_compat” branch and doing an iOS kha-make?
No, the js_compat branch is not fit for general consumption, sorry. Also need to adapt the code changes to Metal.
@RobDangerous, is this the file that the Metal changes need to be adapted into?
Backends/Graphics5/Metal/Sources/Kore/VertexBuffer5Impl.mm
Yes, needs a second unlock implementation which takes a count parameter. Not sure I merged everything that's needed from the jscompat branch though. I can merge in the evening (sorry for things taking so long, there's still that crazy project which I have to finish ASAP).
https://github.com/Kode/Kore/commit/cc386d384fc8f570650bc1536db2ac2c60cf5944
Does this mean the fix is now implemented on iOS?
Hi @RobDangerous. Hope all is well. Was just wondering if you've had any time/luck with this one?
Ah, yes. I merged the things and it turned out that helped with everything but with Metal on iOS. So ironically OpenGL on iOS might be faster now. So still more to do.