klayout
 klayout copied to clipboard
Idea: try parallelisation with C++17 `std::execution`
C++17 contains execution policies with easy parallelisation supported by methods like std::sort, see https://en.cppreference.com/w/cpp/algorithm/execution_policy_tag_t. Additionally, for-loops that are refactorable to std::for_each without data races are easily parallelised.
As C++17 appears to be already quite supported by gcc and clang, would it make sense to test if parts of KLayout could be parallelised using this?
This would of course increase the required version of g++ and clang.
Thanks, but do you have a proof of benfits (e.g. runtime improvement on critical execution paths), or is that a hypothetical idea? One suggestion is that you try that in the EdgeProcessor domain (std::sort is used there) and report runtime/parallelisation/memory effects.
I am not in favor of switching to C++17 myself. EDA users are conservative. Old compilers are widely used (e.g. the ones shipped with CentOS7).
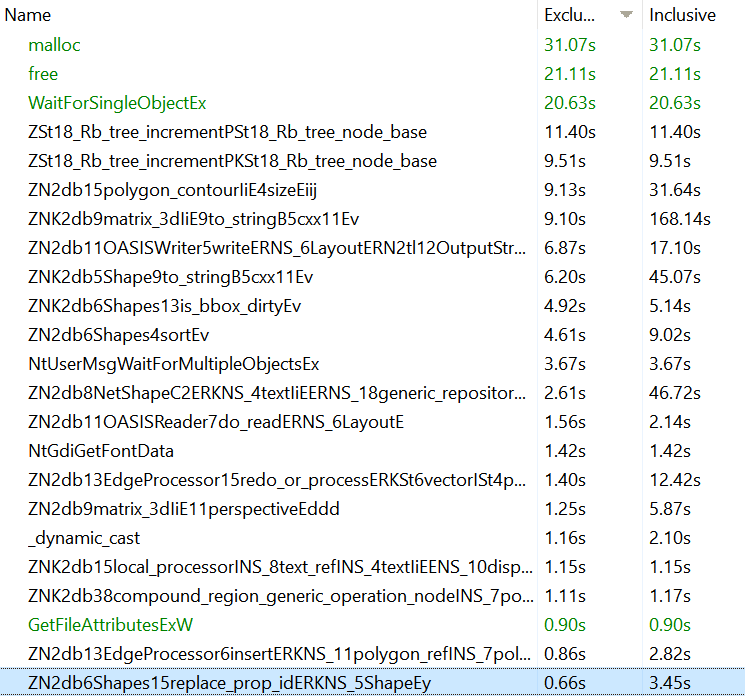
Yes, I tried initial profiling with Very Sleepy for a typical use case:
I can try adding the parallel (and/or vectorisation) policy to some of the places here and benchmarking this at some point.
I also wonder if this matrix.to_string call is somehow inefficient or is it just called a lot of times
https://github.com/KLayout/klayout/blob/f7ef538f343a208603288ed3925b561b00d2336a/src/db/db/dbMatrix.cc#L353-L360
I cannot believe that this profile is real.
"matrix.to_string" is hardly ever called in a normal use case - like once when a session containing an image is persisted. I guess something is wrong with the symbols.
I usually use cachegrind for profiling. It will not only show the times but also how many times a function is called. However, as it implements instrumentation by virtual execution, the run times are many times slower while running in cachegrind.
In general, profiling is one, but not the best way for optimization. The by far largest optimization potential is through algorithmic improvements and profiling gives you some hints where to start with, but not much more.
The EdgeProcessor is a good candidate for optimization as it is a core component (so enhancements have a significant effect in many places) and is not too complex. A similar component is the box scanner which is also used in many places.
Matthias
With regard to profiling, here’s a tool with an interesting approach. https://github.com/plasma-umass/coz
Any updates? I'd close this issue otherwise. I don't see a way to implement that request. Matthias
I haven't had time to experiment with this so I guess this can be closed until further notice.