Metatheory.jl
 Metatheory.jl copied to clipboard
Published
20 hours ago •
 JuliaSymbolics
Use Penrose to visualize e-graphs
trafficstars
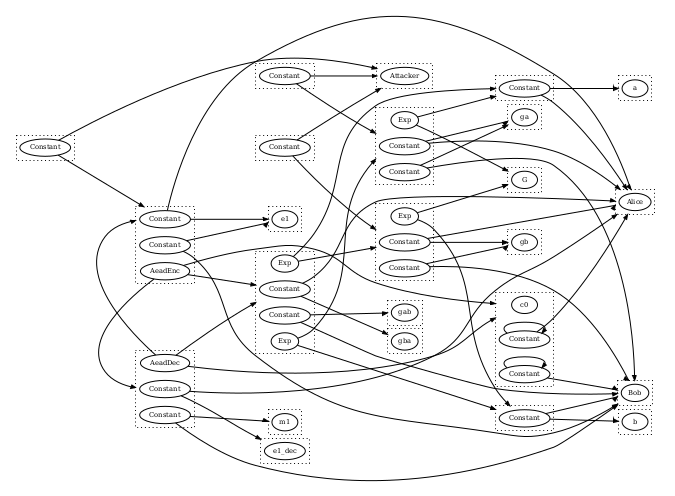
This is a speculative issue. It would be great to visualize an e-graph, and in particular how the saturation proceeds. Arranging the diagram in a visually informative way seems in principle quite difficult. However, Penrose supposedly solves this problem by optimizing diagrams.
Interesting idea.
There's also #41
Something based on https://juliagraphs.org/GraphPlot.jl/ might also be cool to do, but I guess a native GraphViz approach may be the best.
See how egg plots e-graphs