StatsPlots.jl

StatsPlots.jl copied to clipboard
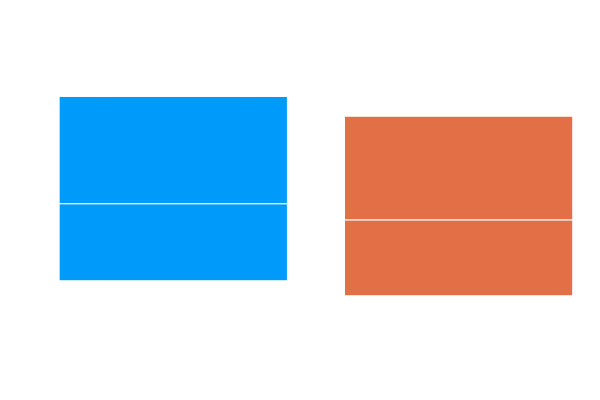
Transparent background also sets axis/grid/etc transparency
Setting the background to transparent or false removes most supporting elements from the plot.
demo
boxplot(rand(50,2), background=false)
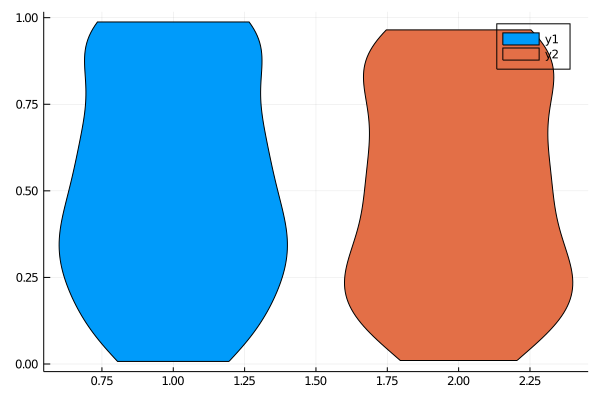
violin(rand(50,2), background=RGBA(0.5,0.5,0.5,0))

This works fine (for pyplot pdf, not for GR pdf)
violin(rand(50,2), background=RGBA(1,1,1,0))