StatsPlots.jl

StatsPlots.jl copied to clipboard
density plot with two arguments should default to contour
would be nice to have. See also this SO question: https://stackoverflow.com/questions/58087096/a-plot-describing-the-density-of-data-points-in-2d-space-in-julia The solution could be based on this other SO question: https://stackoverflow.com/questions/19390320/scatterplot-contours-in-matplotlib
Actually this is mostly in place already. We just need to change the behaviour of density. Consider
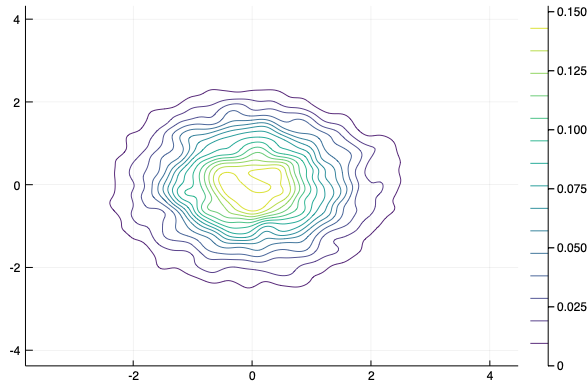
a, b = randn(10000), randn(10000)
dens = StatsPlots.KernelDensity.kde((a,b))
plot(dens)
 but
but
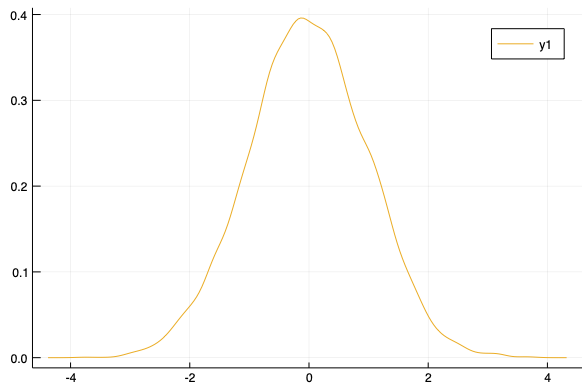
density(a, b)