Plots.jl
 Plots.jl copied to clipboard
[BUG] The curve does not show up if ylims is assigned
Details
I have a particular 1-D array of real values, which I want to plot (say, "myarray", see the values attached in the file "x1.txt"). If I input
plot(myarray[:]),
everything is ok. However, if I input, for instance,
plot(myarray[:],ylims=(-5.0,5.0)),
the curve just dissappears.
Moreover, if I try to plot the first 299 values, it still works
plot(myarray[1:299],ylims=(-5.0,5.0))
But adding one extra point leads to this bug:
plot(myarray[1:300],ylims=(-5.0,5.0))
Any ideas?
Plots.jl version: 1.29.1
This seems to be GR specific, since I can't reproduce this on the pyplot backend.
Probably related to plotting outside of the visible area.
CC: @jheinen
I can't reproduce this in plain GR:
using DelimitedFiles
using GR
y = readdlm("x1.txt")
plot(y)
plot(y, ylim=(-5,5))
plot(y[1:299], ylim=(-5,5))
plot(y[1:300], ylim=(-5,5))
All those plot commands show the expected results.
No idea. Works fine both with GR and Plots:
using DelimitedFiles
using Plots
y = readdlm("x1.txt")
plot(y[1:300], ylim=(-5,5))
I can't reproduce using the terminal either. It's just the VSCode Plot pane. Saving as .png also shows the correct figure. @pfitzseb you got an idea what could cause this?
This is an issue with Plots' svg rendering (or something like that):
using DelimitedFiles
using Plots
y = readdlm("x1.txt")
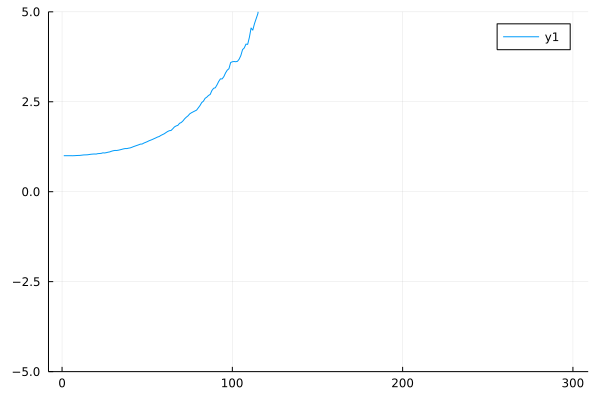
p = plot(y[1:300], ylim=(-5,5))
savefig(p, "plot.svg")
produces

The extreme values for y are (0.9994831798399888, 1.7257495873203134e151). Such huge coorrdinate values lead to problems in most SVG viewers.
This is an MWE:
<?xml version="1.0" encoding="utf-8"?>
<svg xmlns="http://www.w3.org/2000/svg" xmlns:xlink="http://www.w3.org/1999/xlink" width="500" height="500" viewBox="0 0 2000 2000">
<defs>
  <clipPath id="clip01">
    <rect x="0" y="0" width="2000" height="2000"/>
  </clipPath>
</defs>
<polyline clip-path="url(#clip01)" style="stroke:#000000; stroke-linecap:butt; stroke-linejoin:round; stroke-width:4; stroke-opacity:1; fill:none" points="
  400,1000 1800,-10000000000
  "/>
</svg>
Changing the last number from -10000000000 to -40000000000 reproduces the problem.
For further information, see https://oreillymedia.github.io/Using_SVG/extras/ch08-precision.html
I implemented a workaround in the GR SVG plugin in the development tree, but we are still discussing, whether the change(s) really make sense. Alternatively, I could apply soft clipping in the low-level SVG driver, however, IMO this contradicts the philosophy of SVG.