[FR] Arrow annotations
I am not quite sure, what that function exactly is doing. Can you provide an example using PyPlot.
First I thought this about marking points with arrows, but the example in the linked docs look like drawing an arrow with a label, which currently looks like this in Plots:
plot([(1,2), (2,3)], arrow=true, annotation=(1.45, 2.5, "label", 35.), legend=false)
It just draws an arrow at an arbitrary position in the plot. Here's an example with PyPlot:
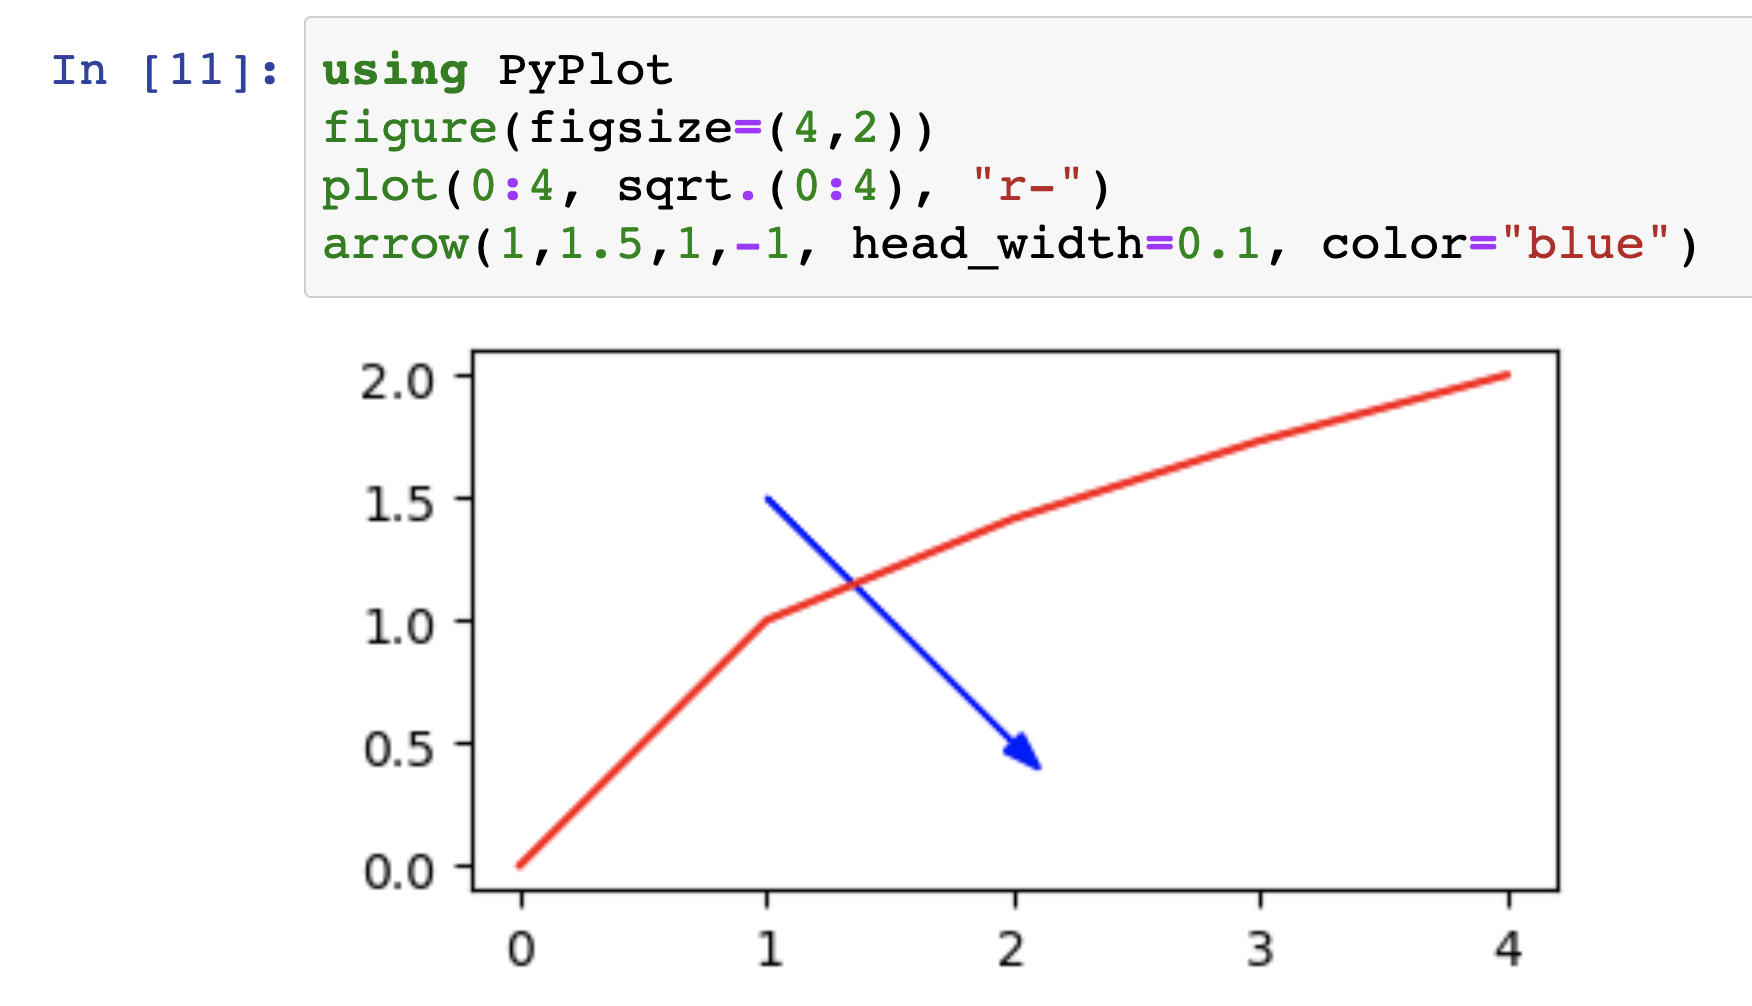
I'd say we already have that... the above would read as
using Plots
plot(0:4, sqrt.(0:4), color = :red, legend = false)
plot!([(1,1.5), (2,0.5)], arrow = arrow(:closed, 0.1), color = :blue)
Though backend support for this varies and I think we should add a version of arrow that works with keywords.
It would be really great if the plotlyjs backend also supports these arrow constructions. Currently, the arrow attribute is not supported in the plotlyjs somehow.