Plots.jl
 Plots.jl copied to clipboard
xlim and ylim to crop 3d plots
Hi,
I am using surface() (pyplot backend) to plot 3D data want wants to limit x and y axis in the plot by xlim and ylim. But as you can see in the attached image, the data still overflows although the axes seems to be filtered accordingly.
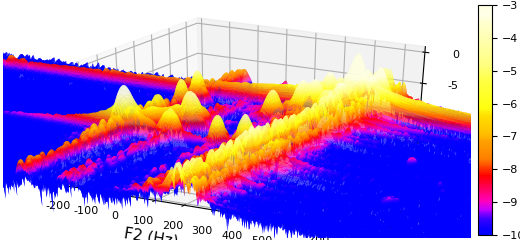
Here's the code I use to generate the image.
julia> surface(f2,
               reverse(f1),
               Matrix(transpose(log.(abs.(spec))));
               clims=(-10,-3),
               xlabel="F2 (Hz)",
               ylabel="F1 (Hz)",
               xticks=-1000:100:1000,
               yticks=-1000:100:1000,
               xlim=[-200,550],
               ylim=[-200,550])
According to this, matplotlib seems to have supported limiting axes in 3d plots with xlim3d, ylim3d, and zlim3d.
Am I missing anything obvious here?
Might be related to #1296 , but in 3d?
Any help would be appreciated! Thanks.
@darrencl please provide MWE with data (self-contained MWE), so that I can investigate this further
@isentropic I'm getting the same issue (with gr)
MWE:
A = [
        0.000182448  0.00423937  0.0104459  0.00423937  0.000182448;
        0.00423937   0.0890948   0.199498   0.0890948   0.00423937;
        0.0104459    0.199498    0.409443   0.199498    0.0104459;
        0.00423937   0.0890948   0.199498   0.0890948   0.00423937;
        0.000182448  0.00423937  0.0104459  0.00423937  0.000182448
        ]

surface(A, xlims=(2,4), ylims=(2,4))
I believe it is reasonable to ask Plots to clip surface data by default outside the specified limits in 3d for all backends.
Just so that it is consistent with 2d where we never plot outside the axis limits.