PlotlyJS.jl
 PlotlyJS.jl copied to clipboard
box plots with numbers as names
I'm trying to create a box plot where the names of the boxes are numbers. The problem is that if I use something like box(;y=cond10, name="10") and similarly for the other boxes, the names are also used to position the boxes on the x-axis -- which I do not want (the boxes should be equally spaced). I tried using html codes for the numbers, but that didn't make a difference. If I add x0=1 etc., then that does make a difference, but then name="10" is ignored and instead the name used is the position given by x0. Does anyone know how to solve this?
Hi @IgorDouven have you tried setting all of y, x0 and name for your traces
This seemed to work for me:

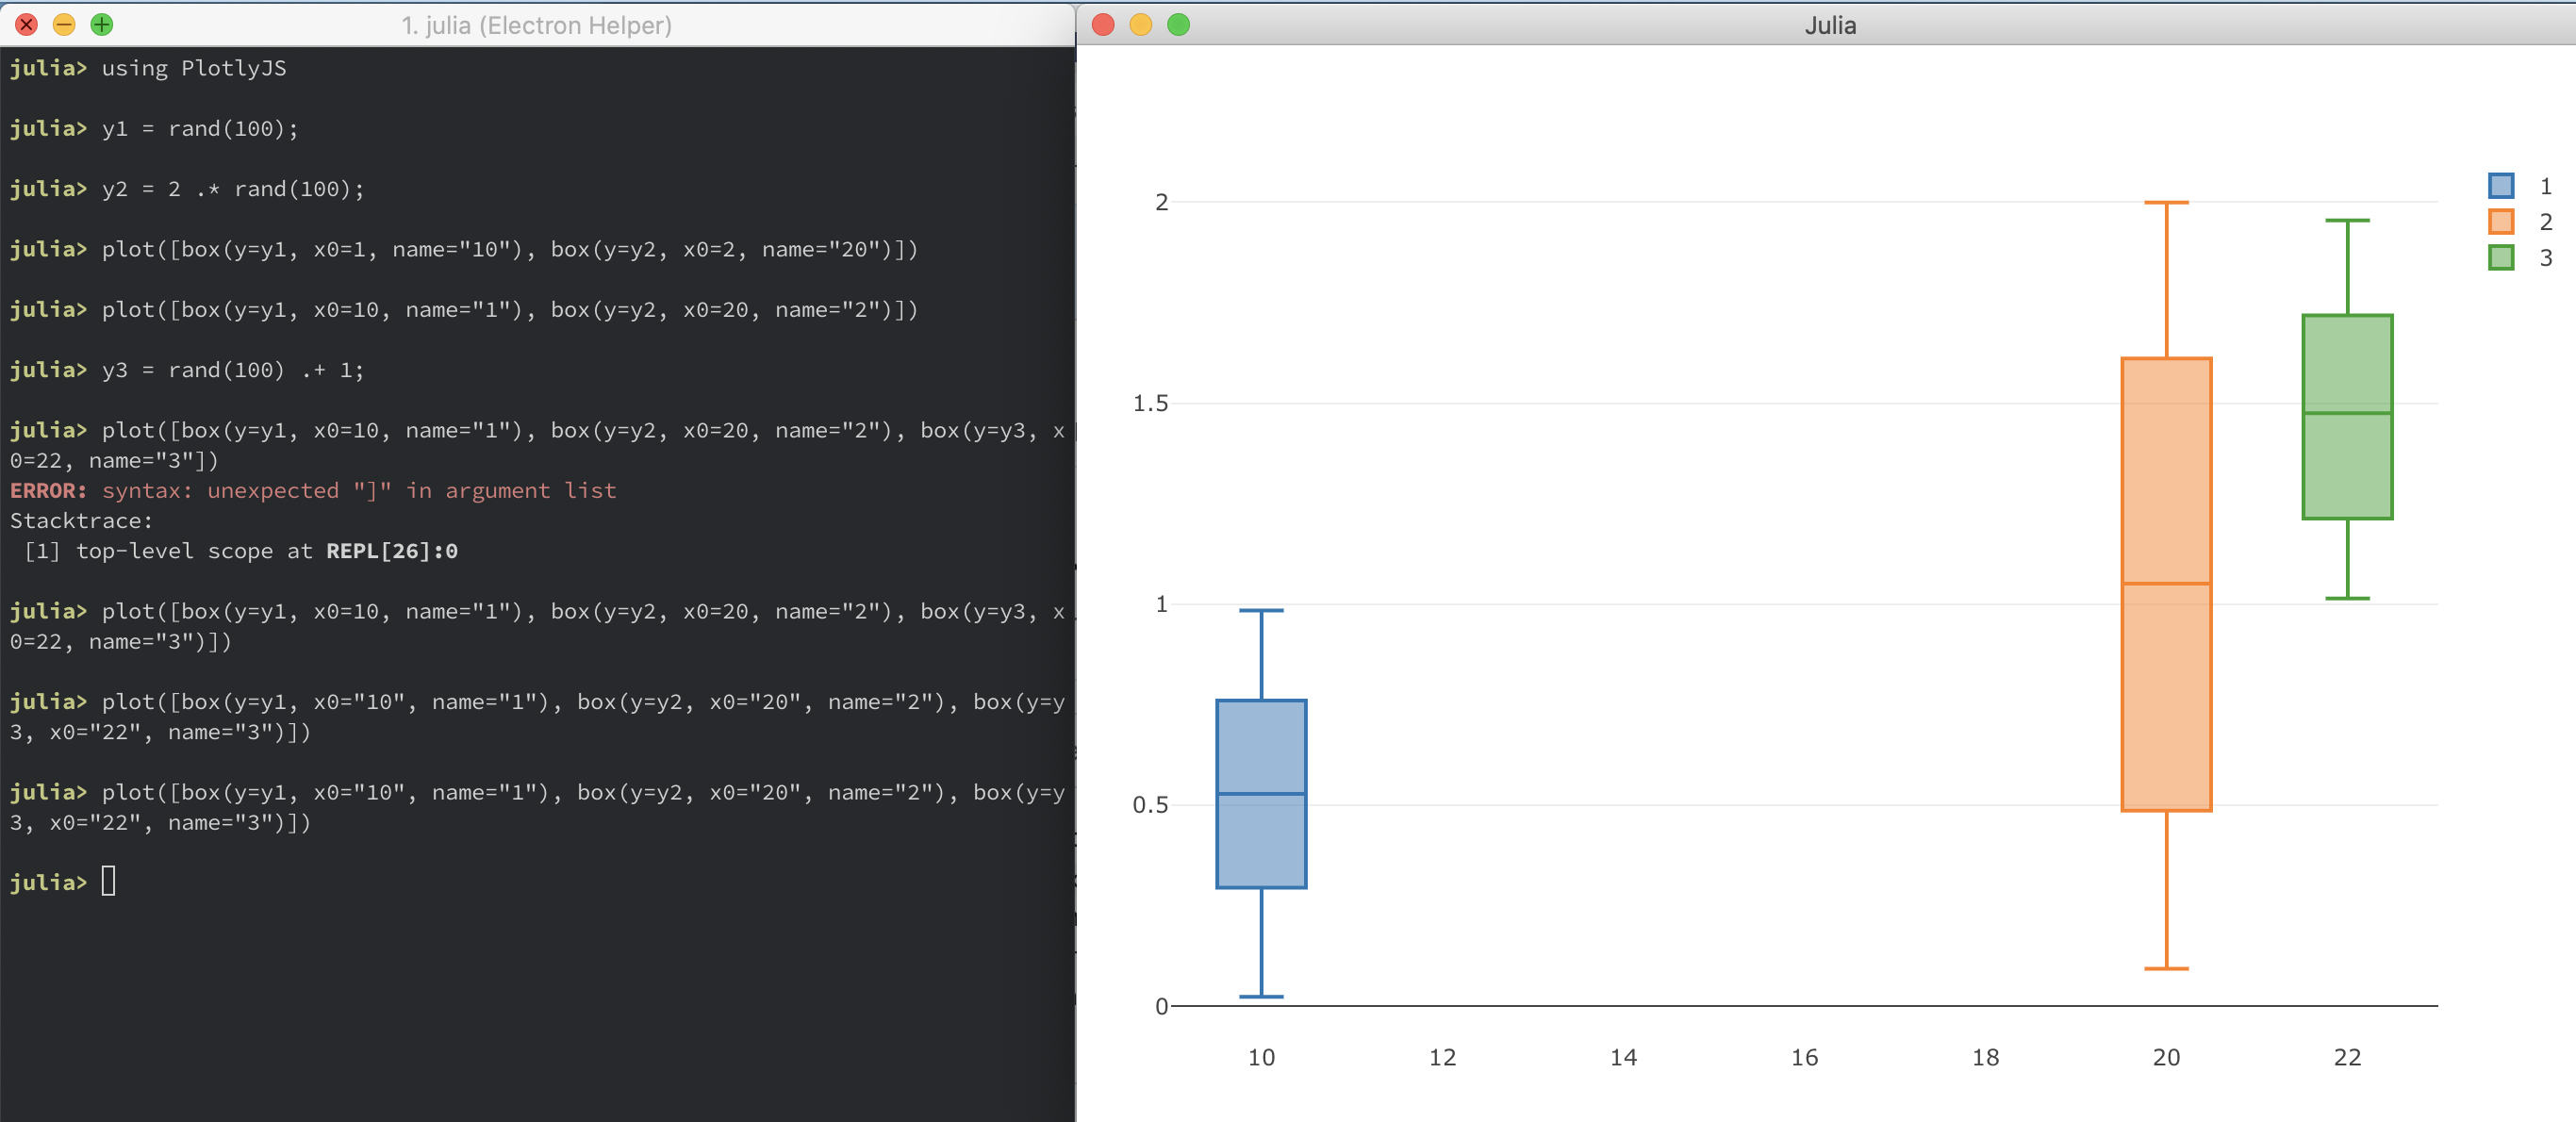
Could you get away with adding a prefix to the x0 coordinate so that it is not interpreted by plotly as a number?

Thanks @sglyon for looking into this. This is indeed the problem. In my case, it would be ugly to use a prefix. What I do now is use as labels X, Y, etc., and then replace those by the numbers I need in Adobe Illustrator. That's not ideal, to say the least.
What surprises me is that the problem does not arise when I try to create the same figure in R using the plotly package. There I put my x- and y-values in a data.frame and can simply do plot_ly(df, x=~x_vals, y=~y_vals, type="box") and everything works out fine. That is to say: I have to make sure x_vals is a factor. I tried to do the same in Julia, using a CategoricalArray, but to no avail.
That is very surprising.
Would you be willing to recreate a simple R script that shows your usecase and the "proper" result? Also the julia script that is mis-behaving.
Under the hood they are both using plotly.js so I'm surprised there is a difference here.
Yes, it's surprising. But just compare:
library(plotly)
X <- factor(rep(c(1, 2, 5), each=10))
Y <- runif(30)
df <- data.frame(X, Y)
plot_ly(df, x=~X, y=~Y, type="box")
Same in Julia:
using PlotlyJS
using DataFrames
X = repeat([1, 2, 5], inner=10)
Y = rand(30)
df = DataFrame(A = X, B = Y)
plot(df, x=:A, y=:B, type="box")
The R code gives the desired result (there is no more space between the '2' and the '5' box than between the '1' and the '2' box). In Julia, I have tried many things to realize this. Make A categorical, use strings, use html code instead of numbers -- nothing works.