GraphRecipes.jl
 GraphRecipes.jl copied to clipboard
tiny fonts and markers
Julia VERSION: v"0.5.1-pre+55"
Plots: v"0.10.3"
PlotRecipes: v"0.2.0"
LightGraphs: v"0.7.2"
hi, just looking for some guidance with tree display. i'm trying to use the graphplot() recipe to plot LightGraph trees, but when i add node labels using names= the markers and fonts become so small they're unreadable. here's what i mean:
using LightGraphs, PlotRecipes
pyplot(alpha=0.5, size=(800, 400))
g = Graph(4)
add_edge!(g, 1, 2)
add_edge!(g, 1, 3)
add_edge!(g, 1, 4)
graphplot(g, names=1:4, method=:tree
 when i zoom in using
 plotly(), the text and markers keep the same tiny size. the markersize= option doesn't seem to adjust the markers at all. i've confirmed the same behavior on Windows and macOS, as well as with both PyPlot() and plotly() backends. so i'm not sure what i'm doing wrong.
i'd like to be able to use the larger default circles, but with large, readable labels, if possible. thanks.
graphplot(g, method=:tree)

I think there might be a fontsize keyword? This recipe needs love and documentation. If you have the time it would be awesome if you could help out.
On Wed, Feb 22, 2017 at 10:58 PM Rob Sanchez [email protected] wrote:
hi, just looking for some guidance with tree display. i'm trying to use the graphplot() recipe to plot LightGraph trees, but when i add node labels using names= the markers and fonts become so small as to be unreadable. here's what i mean:
using LightGraphs, PlotRecipes pyplot(alpha=0.5, size=(800, 400)) g = Graph(4) add_edge!(g, 1, 2) add_edge!(g, 1, 3) add_edge!(g, 1, 4) graphplot(g, names=1:4, method=:tree [image: small] https://cloud.githubusercontent.com/assets/17532588/23244001/8d61ef80-f950-11e6-968d-b00716c19b3c.png when i zoom in using plotly(), the text and markers keep the same tiny size. the markersize= option doesn't seem to adjust the markers at all. i've confirmed the same behavior on Windows and macOS, as well as with both PyPlot() and plotly() backends. so i'm not sure what i'm doing wrong.
i'd like to be able to use the larger default circles, but with large, readable labels, if possible. thanks.
graphplot(g, method=:tree) [image: large] https://cloud.githubusercontent.com/assets/17532588/23244080/eabdabf6-f950-11e6-8a63-0cbc15932561.png
— You are receiving this because you are subscribed to this thread. Reply to this email directly, view it on GitHub https://github.com/JuliaPlots/PlotRecipes.jl/issues/14, or mute the thread https://github.com/notifications/unsubscribe-auth/AA492ksgJNWABmsXzyTOB_iQeXX0C9NYks5rfQQBgaJpZM4MJhFR .
Thanks! I'd be happy to help if I can, but I think I need to understand this better first, currently I'm still confused. I'm able to change the font size, but the markersize is still very small with plotly(). So in effect the tree graph is still unreadable. This is odd, because none of the examples on Plots.jl or PlotRecipes.jl seem to have this problem.
This is with plotly() backend enabled:
graphplot(g, marker=:circle, markersize=35, fontsize=16, names=1:4, method=:tree)

This is the same but with pyplot() instead, which is better, but I'd still like to change the markersize if possible:

So I'm not quite getting it just yet. I've been through the code, but I still can't make heads or tails of which attributes apply to graphplot() and which ones don't. Any hints?
Thanks again for your help.
Weird. If I do:
using PlotRecipes, LightGraphs
g = LightGraphs.StarGraph(10)
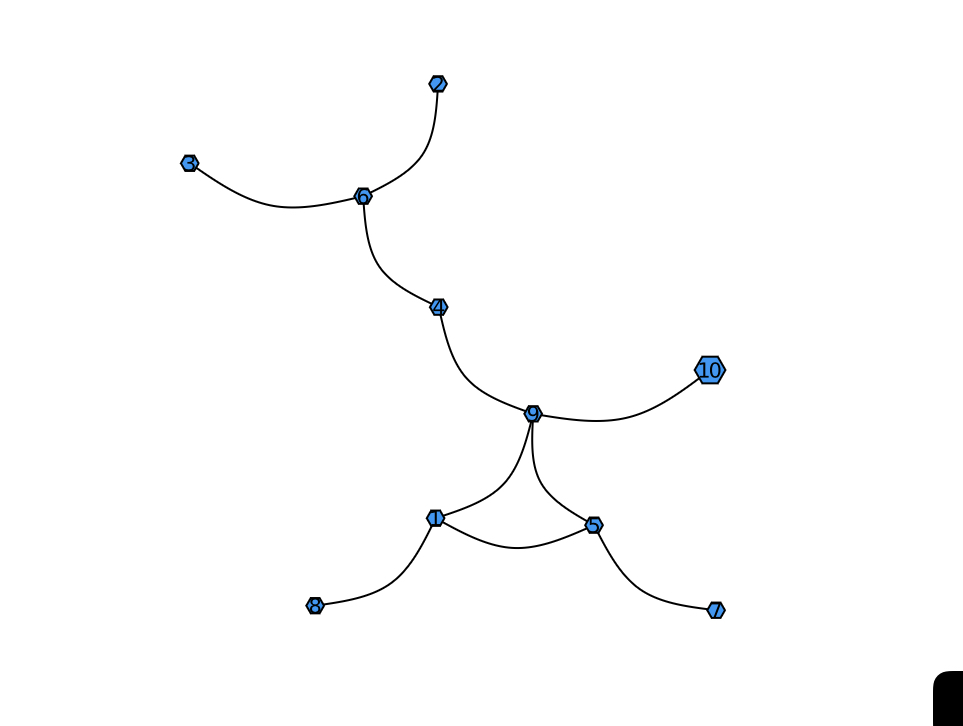
graphplot(g, marker=:circle, markersize=2, fontsize=16, names=1:10, method=:tree)
I see:

Notice this is with markersize=2, which means basically "make it 2x as big as normal"
Maybe the marker sizing only works on GR? Note that when you add names, you are using "series annotations", not markers. Using markersize is just trickery.
Alright then, I wasn't able to get GR working earlier but I'll give it another shot, and I'll try to understand "series annotations" better instead, thanks!
[28b8d3ca] GR v0.53.0
[bd48cda9] GraphRecipes
[093fc24a] LightGraphs v1.3.3
[91a5bcdd] Plots v1.9.1
The default font size and node size is still too small.
using LightGraphs
using Plots
using GraphRecipes

node_number = 10
edge_prob = 0.1
G = erdos_renyi(node_number, edge_prob)
graphplot(G, names=1:nv(G))