GraphRecipes.jl
 GraphRecipes.jl copied to clipboard
Drawing a self-edge removes labels
After drawing a self-edge labels disappear from any subsequent drawn graphs. Requires a package reload to draw labels again.
Thanks for this. Do you have a MWE? I am having a little difficulty replicating the problem,
n = 6
g = wheel_graph(n)
add_edge!(g,1,1)
graphplot(g) |> display
g2 = barabasi_albert(n,1)
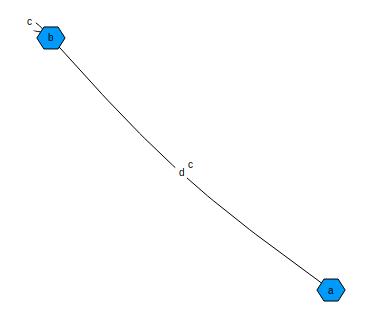
graphplot(g2,edgelabel=Dict((1,2)=>"hello"))
works fine for me.
Yeah, sorry didnt take time to narrow it down. I am plotting from LightGraphs. Will look more into it later today.
Ok, got the minimal version (can go more minimal if needed):
using GraphRecipes, Plots
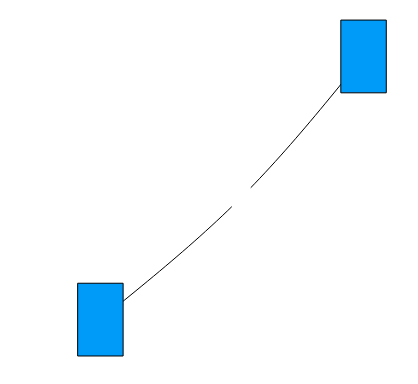
graphplot([[2], [2]]; names = ["a", "b"], edgelabel=Dict((2, 2) => "c", (1, 2) => "d"))
On the first draw already the loop and nodes labels are missing:
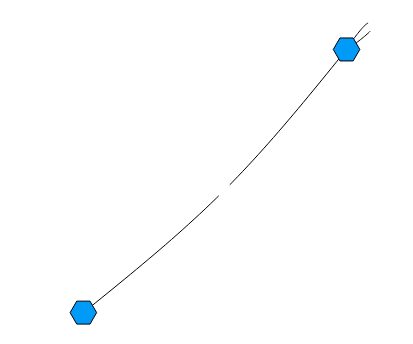
All subsequent draws (even other graphs) do not display any labels:
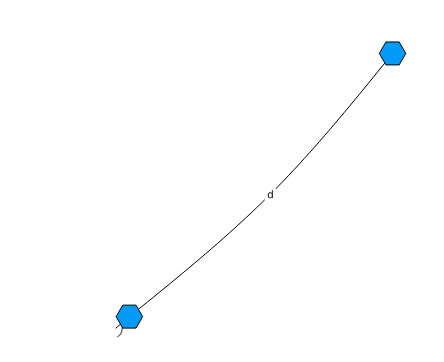
The above was GR backend, just tried plotlyjs. This time it doesnt disappear, but the self-edge label ends up weirdly on the edge between nodes:
I don't know if it is related, but when I set edgelabel = some_mat with the GR backend it says:
Warning: Attribute alias `annotation` detected in the user recipe defined for the signature (::GraphRecipes.GraphPlot). To ensure expected behavior it is recommended to use the default attribute `annotations`.
And the edge labels are blank, like in the example above.
It seems to be the problem with NaN when processing the edges. I have fixed this issue I think: https://github.com/congUoM/GraphRecipes.jl/commit/29b061a018738cd6798272affbb6236070214238