AlgebraOfGraphics.jl
 AlgebraOfGraphics.jl copied to clipboard
How to create an ordered bar plot?
I'm trying to create a bar plot which shows the population size of different regions and would like to order the bars according to population size (see: https://github.com/roland-KA/StatisticalPlotsWithJulia, the bar plot is in the Pluto notebook notebooks/DV-Basics-AlgebraOfGraphics.jl in section "Population by Subregion")
But up to now, I didn't succeed:
- AoG ignores the sorting order of the DataFrame given as an argument to
data. So sorting the data in advance doesn't help. - Using
sorterchanges the order of the bars, but not in the way I intended. This is perhaps a problem of the documentation (and my lack of understanding), which doesn't tell much about whatsorterreally does.
A detailed description of the problem as well as the code I created so far can be found in the Pluto notebook mentioned above.
I'm facing the same problem that AoG ignores the sorting order of the DataFrame.
I would like to let here a snippet of a reproducible code of that case, to help the devs.
import Downloads: download
using CSV, DataFramesMeta, Statistics
using AlgebraOfGraphics, CairoMakie
# download and read data
const DATADIR = "netflix/data/";
filename = DATADIR * "netflix_titles.csv"
download("https://raw.githubusercontent.com/rfordatascience/tidytuesday/master/data/2021/2021-04-20/netflix_titles.csv",
filename)
rawdata = CSV.read(DATADIR*"netflix_titles.csv", DataFrame)
# clean raw data
df = @chain rawdata begin
transform!(
:date_added => ByRow(passmissing(x -> Date(strip(x), dateformat"U d, Y"))) => :date_added_clean,
:duration => ByRow(x -> split(x, " ")) => [:durationtime, :durationunits])
transform!(:durationtime => x->parse.(Int,x), renamecols=false)
end
# median duration per genre
dfp = @chain df begin
subset(
:durationunits => (x->x .== "min"),
:type => (x-> x.=="Movie"))
transform(:listed_in => ByRow(x-> split(x, ", ")) => :genre)
flatten(:genre)
groupby(:genre)
combine(:durationtime => median => :mediantime)
sort(:mediantime, rev=true)
end
plt = data(dfp) *
mapping(:genre => "Median Duration time", :mediantime => "") *
visual(BarPlot, direction=:x, color=:darkblue)
f = Figure()
draw!(f, plt;
axis=(;
yticks=(1:20, dfp.genre),
xticks=(0:20:maximum(dfp.mediantime)),
ygridvisible=false,
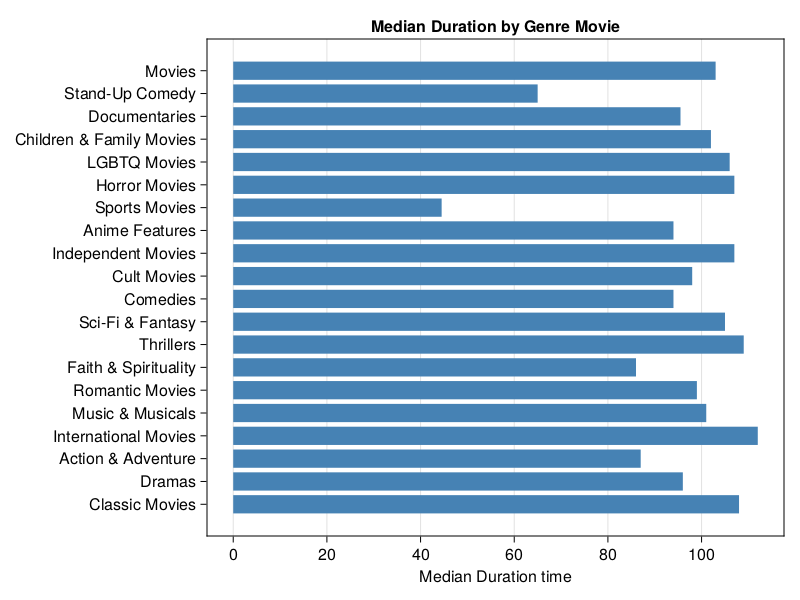
title="Median Duration by Genre Movie"))
f
that result to this unordered plot