cornerplot and corrplot
Any plans to add cornerplot and corrplot like in StatsPlots.jl? Perhaps it is already possible to achive similar result with AOG?
Something like
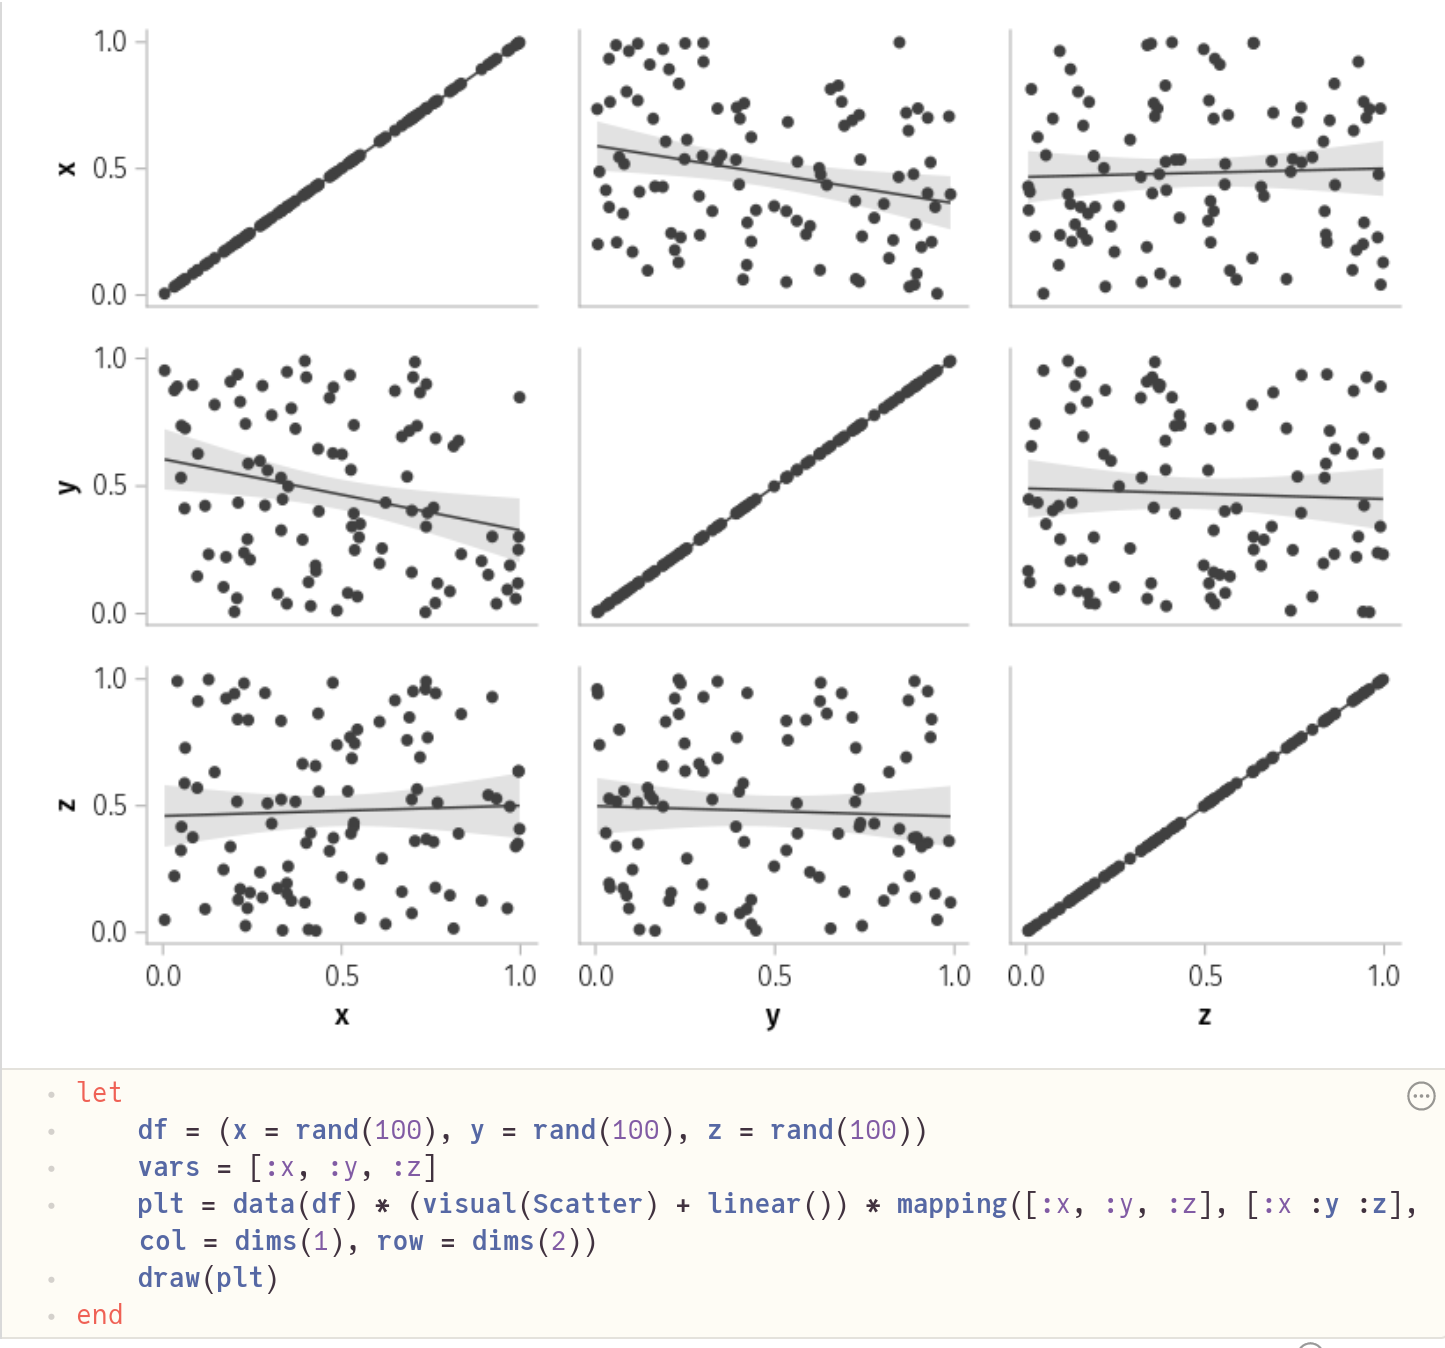
df = (x = rand(100), y = rand(100), z = rand(100))
vars = [:x, :y, :z]
data(df) * (visual(Scatter) + linear()) * mapping([:x, :y, :z], [:x :y :z], col = dims(1), row = dims(2))
would do a "symmetric" corrplot. It's definitely planned to have the full corrplot functionality available, but the interface / implementation are not super clear. See also #187 and https://github.com/piever/SplitApplyPlot.jl/issues/53#issuecomment-831144023
@piever can you please clarify the col/row mechanism? Couldn't find it in the docs. I am having trouble creating the corner/corrplot using the snippet you shared above.
I am also having some trouble undestanding how does this col, row, dims mechanism work.
In your example your diagonal will be just a straight line.
is there a way to substitute the diagonal plots with the density functions instead ?

Something like
df = (x = rand(100), y = rand(100), z = rand(100))
vars = [:x, :y, :z]
data(df) * (visual(Scatter) + linear()) * mapping([:x, :y, :z], [:x :y :z], col = dims(1), row = dims(2))
would do a "symmetric"
corrplot.
@piever I have data in x and would like to split x by a categorical cycling variable group, plotting a 4x4 corner plot where subplot (i, j) compares x-values of group i with x-values of group j. Can this example be modified for something like this? e.g. data
df = (x = rand(100), group=repeat(1:4, 25))
I think something like
data(df) * (visual(Scatter) + linear()) * mapping(:x, :x, col = :group => nonnumeric, row = :group => nonnumeric)
should do the trick in that case.
EDIT: as pointed out below, this does not do the desired thing.
The things that are not supported at the moment are adding marginal histograms in a simple way (either around the layout or in the diagonal) and doing asymmetric things (lower triangle is different from upper triangle). I'm not sure if there is a simple way to support that consistently within AoG, or whether one is better off adding some sort of "recipe with rich layout" to Makie, where a plot gets a subfigure instead of just an axis. There is a little bit of discussion on that around https://github.com/piever/SplitApplyPlot.jl/issues/53#issuecomment-831157780
I think something like
data(df) * (visual(Scatter) + linear()) * mapping(:x, :x, col = :group => nonnumeric, row = :group => nonnumeric)should do the trick in that case.
This doesn't seem to:

Ah yes, of course you are right... I'm afraid there is no way at the moment other than manually unstacking the data to pass to the wide format.
Is this something you would be interested in adding as a feature? And have you already thought about the "AoG" interface for such a thing? Or do you think it should just be a Makie recipe with DataFrame input because it can't really leverage any AoG features?
Update: PairPlots.jl provides this functionality with Makie.jl
Em ter., 19 de set. de 2023 03:06, Patrick Kofod Mogensen < @.***> escreveu:
Is this something you would be interested in adding as a feature? And have you already thought about the "AoG" interface for such a thing? Or do you think it should just be a Makie recipe with DataFrame input because it can't really leverage any AoG features?
— Reply to this email directly, view it on GitHub https://github.com/MakieOrg/AlgebraOfGraphics.jl/issues/210#issuecomment-1724881198, or unsubscribe https://github.com/notifications/unsubscribe-auth/AAZQW3I6GPSOHRJXCFFEUZ3X3EY67ANCNFSM46L756PQ . You are receiving this because you authored the thread.Message ID: @.***>