julia
 julia copied to clipboard
glibc is optimized for memory allocations microbenchmarks
This problem was originally reported in the helpdesk Slack against DataFrames, but I believe I have replicated it just using vectors of vectors.
OP was using Julia 1.5.0 with DataFrame 1.2.2 on Linux I used Julia 1.6.2 on WSL2 Ubuntu
Just using vectors, everything behaves as expected and julia's allocated memory does not increase:
function inner_df(Nrow,Ncol) # Create small dataframe
    rand(Nrow*Ncol)
end

function outer_df(N) #Stack small dataframes
    Nrow=76
    Ncol=21
    df = Vector{Float64}(undef,0)
    for i = 1:N
        append!(df,inner_df(Nrow,Ncol))
    end
    return df
end

function iterated(Niter) # Create a large DataFrame many times.
    for i =1:Niter
        println(i)
        @time pan = outer_df(1000*10*10)
    end
    nothing
end


# (code and top lines after the code)
iterated(1)
GC.gc()
# 12142 user      20   0 1892304 215296  64744 S   0.0   1.3   0:19.41 julia
iterated(10)
GC.gc()
# 12142 user      20   0 1892416 226740  65412 S   0.0   1.4   1:51.96 julia
iterated(10)
GC.gc()
# 12142 user      20   0 1892416 227000  65416 S   0.0   1.4   3:25.04 julia
iterated(20)
GC.gc()
# 12142 user      20   0 1892416 227104  65416 S   0.0   1.4   6:32.83 julia
Using vectors of vectors, there seems to be a memory leak:
function inner_df(Nrow,Ncol) # Create small dataframe
    [rand(Nrow) for i in 1:Ncol]
end

function outer_df(N) #Stack small dataframes
    Nrow=76
    Ncol=21
    df=[Vector{Float64}(undef, 0) for i in 1:Ncol]
    for i = 1:N
        df2 = inner_df(Nrow,Ncol)
        for j in 1:Ncol
            append!(df[j],df2[j])
        end
    end
    return df
end

function iterated(Niter) # Create a large DataFrame many times.
    for i =1:Niter
        println(i)
        @time pan = outer_df(1000*10*10)
    end
    nothing
end


# (code and top lines after code)
iterated(1)
GC.gc()
#  9204 user      20   0 2275056 216848  64844 S   0.0   1.3   0:15.61 julia
iterated(10)
GC.gc()
#  9204 user      20   0 3339728 952280  64844 S   0.0   5.7   1:06.03 julia
iterated(10)
GC.gc()
#  9204 user      20   0 3339728 952876  64844 S   0.0   5.7   1:55.75 julia
iterated(20)
GC.gc()
#  9204 user      20   0 3343824 953112  64964 S   0.0   5.7   3:31.63 julia
Please feel free to close if this is a vagary of Linux memory management.
Edit: This comment is probably not worth your time to read
I'm on a mac (11.4) and for this comment I'm using the standard Julia REPL from 1.6.1 in a standard mac terminal.
I'm not sure what # 9204 user 20 0 3343824 953112 64964 S 0.0 5.7 3:31.63 julia means, but tried to replicate it on my machine.
#fresh session
#95 MB
#your function declarations
#116 MB
iterated(1)
#1.81 GB
GC.gc()
#631 MB
iterated(10)
#1.47 GB
GC.gc()
#648 MB
And in another way
#Fresh julia session
#95 MB
function inner_df(Nrow,Ncol) # Create small dataframe
           [rand(Nrow) for i in 1:Ncol]
       end
function outer_df(N, Nrow, Ncol) #Stack small dataframes
           df=[Vector{Float64}(undef, 0) for i in 1:Ncol]
           for i = 1:N
               df2 = inner_df(Nrow,Ncol)
               for j in 1:Ncol
                   append!(df[j],df2[j])
               end
           end
           return df
       end
function iterated(Niter, N, Nrow, Ncol) # Create a large DataFrame many times.
           for i =1:Niter
               println(i)
               @time pan = outer_df(N, Nrow, Ncol)
           end
           nothing
       end
#128 MB
iterated(1,1,1,1); GC.gc()
#134 MB
iterated(10,100_000,76,11); GC.gc()
#621 MB
iterated(10,100_000,76,11); GC.gc()
#621 MB
And in another way
#Fresh julia session
#95 MB
function inner_df(Nrow,Ncol) # Create small dataframe
           [rand(Nrow) for i in 1:Ncol]
       end
function outer_df(N, Nrow, Ncol) #Stack small dataframes
           df=[Vector{Float64}(undef, 0) for i in 1:Ncol]
           for i = 1:N
               df2 = inner_df(Nrow,Ncol)
               for j in 1:Ncol
                   append!(df[j],df2[j])
               end
           end
           return df
       end
#125 MB
outer_df(1_000, 67, 21); GC.gc()
#149 MB
outer_df(10_000, 67, 21); GC.gc()
#160 MB
outer_df(100_000, 67, 21); GC.gc()
#465 MB
outer_df(300_000, 67, 21); GC.gc()
#821 MB
outer_df(300_000, 67, 21); GC.gc()
#822 MB
1+1; GC.gc()
#822 MB
I conclude that -While I am not expert in memory management, there seems to be a memory leak -It's size depends on N -Iteration does not result in increased memory use
I hope to look into this and try to simplify the MWE more later today.
Well, at least it's great to see that I'm not the only one with this issue. Cross-referencing to the issue I created on DataFrames.jl (https://github.com/JuliaData/DataFrames.jl/issues/2902).
On my end I have checked using Julia 1.5.0, 1.5.3, 1.6.1 and using two different computers (one with Ubuntu 18.12 and one with a 20.04 Ubuntu-clone (Pop!_os).
Edited to add: @LilithHafner the # 9204 user 20 0 3343824 953112 64964 S 0.0 5.7 3:31.63 julia is the output from top in Linux. I think OS X has the same, just with a different ordering and some different columns.
I've reproduced this issue. Here is a MWE:
julia> [zeros(10) for _ in 1:10^7]; GC.gc()
Or
julia> f(a,b) = [zeros(a) for _ in 1:b]
f (generic function with 1 method)

julia> f(10, 10^7); GC.gc()
Both of which leave Julia using 1.6 GB of memory after garbage collection.
I think the problem happens when Julia needs many pointers at the same time:
function re_use(n)
    x = Vector{Vector{Int}}(undef, n)
    el = Int[]
    for i in 1:n
        x[i] = el
    end
end
function many_pointers(n)
    x = Vector{Vector{Int}}(undef, n)
    el = Int[]
    for i in 1:n
        y = Int[]
        x[i] = el
    end
end
function many_pointers_same_time(n)
    x = Vector{Vector{Int}}(undef, n)
    for i in 1:n
        x[i] = Int[]
    end
end

@time re_use(10^7)
#  0.064684 seconds (3 allocations: 76.294 MiB, 8.75% gc time)
@time many_pointers(10^7)
#  0.614698 seconds (10.00 M allocations: 839.234 MiB, 29.12% gc time)
@time many_pointers_same_time(10^7)
#  1.559850 seconds (10.00 M allocations: 839.233 MiB, 39.60% gc time)
#Only now does GC.gc() fail to reduce memory use
What I have been able to reproduce is not a leak per se, because repeated actions do not increase memory usage, but it is nonetheless large memory usage where I think there should be much less.
Has anyone been able to reproduce a leak which involves a linear growth in unreleased memory with respect to iterations of a supposedly pure function?
Most likely, this is not really a "leak" since, as you can see, we are still able to reuse the memory on future runs. It seems to be about when memory is released to the system. Might be similar to #30653, where we needed to call malloc_trim. You can try adjusting the heuristics at https://github.com/JuliaLang/julia/blob/1389c2fc4af952f5c8b9759cf6fe633995b523f9/src/gc.c#L3185 to see if that helps.
Yes! It does seem like a memory release to system problem.
GC.gc(true); GC.gc()
Does not fix it.
@JeffBezanson is it possible to call malloc_trim manually without rebuilding Julia? I tried ccall(:malloc_trim, Int32, (Int32,), 0) and ccall((:malloc_trim, "malloc"), Int32, (Int32,), 0), but neither worked, and I imagine Revise.jl doesn't work for editing .c files in Julia's source.
If malloc_trim does not work...
Perhaps we are allocating many times from the heap, in a way that requires a lot of space (i.e. not freeing between subsequent mallocs) which results in a collection of many allocations scattered around the heap, and when we finally free almost all of them, the remaining few still have a high "high water point" in heap space, so (if this man page is accurate) simply malloc_freeing is not enough.
In the example of, say [zeros(10) for _ in 1:10^7]; GC.gc(), I have to wonder what those remaining few allocations are as there shouldn't be very many objects malloced after the first few MB are allocated and before garbage collection can run.
Has anyone tried investigating this issue on this PR? It'd be interesting if that provides any additional insight (cc: @NHDaly , @vilterp)
Looks like this one, perhaps: https://sourceware.org/bugzilla/show_bug.cgi?id=27103
Perhaps it isn't actually accepted as a bug? I don't know how this community works: https://sourceware.org/pipermail/libc-help/2020-December/005596.html
@vtjnash Why have you closed this issue? There isn't definitive evidence that it's a glibc bug, and even if there were, shouldn't it stay open until the issue is fixed upstream or Julia has implemented a workaround?
Because it is not a Julia bug, but seems to be an intentional feature of the linux/gnu OS, and it makes it harder to track real bugs.
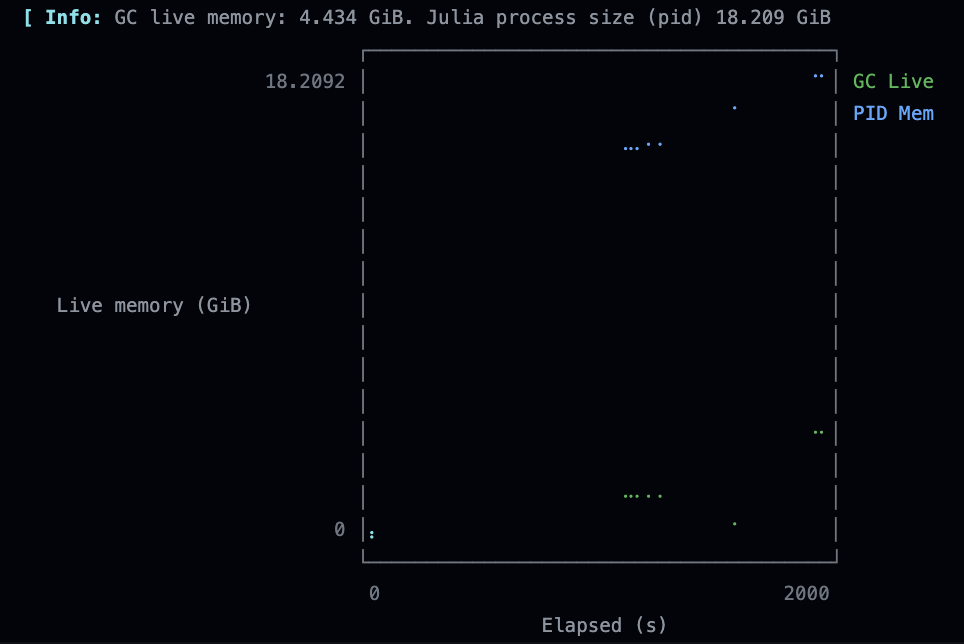
I've been seeing a long running ubuntu x86 CI run getting OOM killed and it appears to be related to this.
All the tests are enclosed in @testsets and julia appears to think the memory is being freed.
Periodically monitoring
gc_live = Base.format_bytes(Base.gc_live_bytes())
pid_mem = Base.format_bytes(parse(Int, strip(read(`ps -o rss= $(getpid())`, String))) * 1024)
I see the following profile over time (this is just before the run was killed)
I tried the heap snapshot PR rebased on master, but it's currently segfaulting
Ok, I got the heap snapshot to work, and this is with malloc_trim(0) changed to run for every GC.gc(true).
On MacOS.
julia> open("before.heapsnapshot", "w") do io
           GC.take_heap_snapshot(io)
       end

julia> x = [zeros(10) for _ in 1:10^7];

julia> open("during.heapsnapshot", "w") do io
           GC.take_heap_snapshot(io)
       end

julia> x = nothing

julia> GC.gc(true)

julia> open("after.heapsnapshot", "w") do io
           GC.take_heap_snapshot(io)
       end
(ignore the row highlights)
| Before (julia 162 MB) | During (julia 1.54 GB) | After (julia 1.50 GB) |
|---|---|---|
 |
 |
 |
The array is present in the during case, but the state of the heap appears to restore afterwards even though the julia process retains the majority of the memory.
Also, given malloc_trim(0) is being called here, it appears to either be a julia bug or a glibc bug, given that freeing is what it's supposed to do according to https://sourceware.org/bugzilla/show_bug.cgi?id=27103, so not an intentional upstream feature?
Yes! It does seem like a memory release to system problem.
GC.gc(true); GC.gc()
Does not fix it.
@JeffBezanson is it possible to call
malloc_trimmanually without rebuilding Julia? I triedccall(:malloc_trim, Int32, (Int32,), 0)andccall((:malloc_trim, "malloc"), Int32, (Int32,), 0), but neither worked, and I imagine Revise.jl doesn't work for editing .c files in Julia's source.
In the https://github.com/JuliaLang/julia/issues/30653#issuecomment-481940653 they call it as ccall(:malloc_trim, Cvoid, (Cint,), 0) would that work for you, or still nothing?
I modified the source to call that for every GC.gc already.
But.. it was just pointed out to me that MacOS doesn't use glibc so perhaps I should have done something similar but for MacOS.
There is no malloc_trim in macos libc, at least man and google tell me so, apparently it's a GNU specific extension.
Another datapoint. This is with MacOS's instruments running
julia -e "x = [zeros(10) for _ in 1:10^7]; sleep(5); x = nothing; GC.gc(true); sleep(5);"
It appears to only know about a few hundred MiB, but the process rises to 1.5 GB and stays there
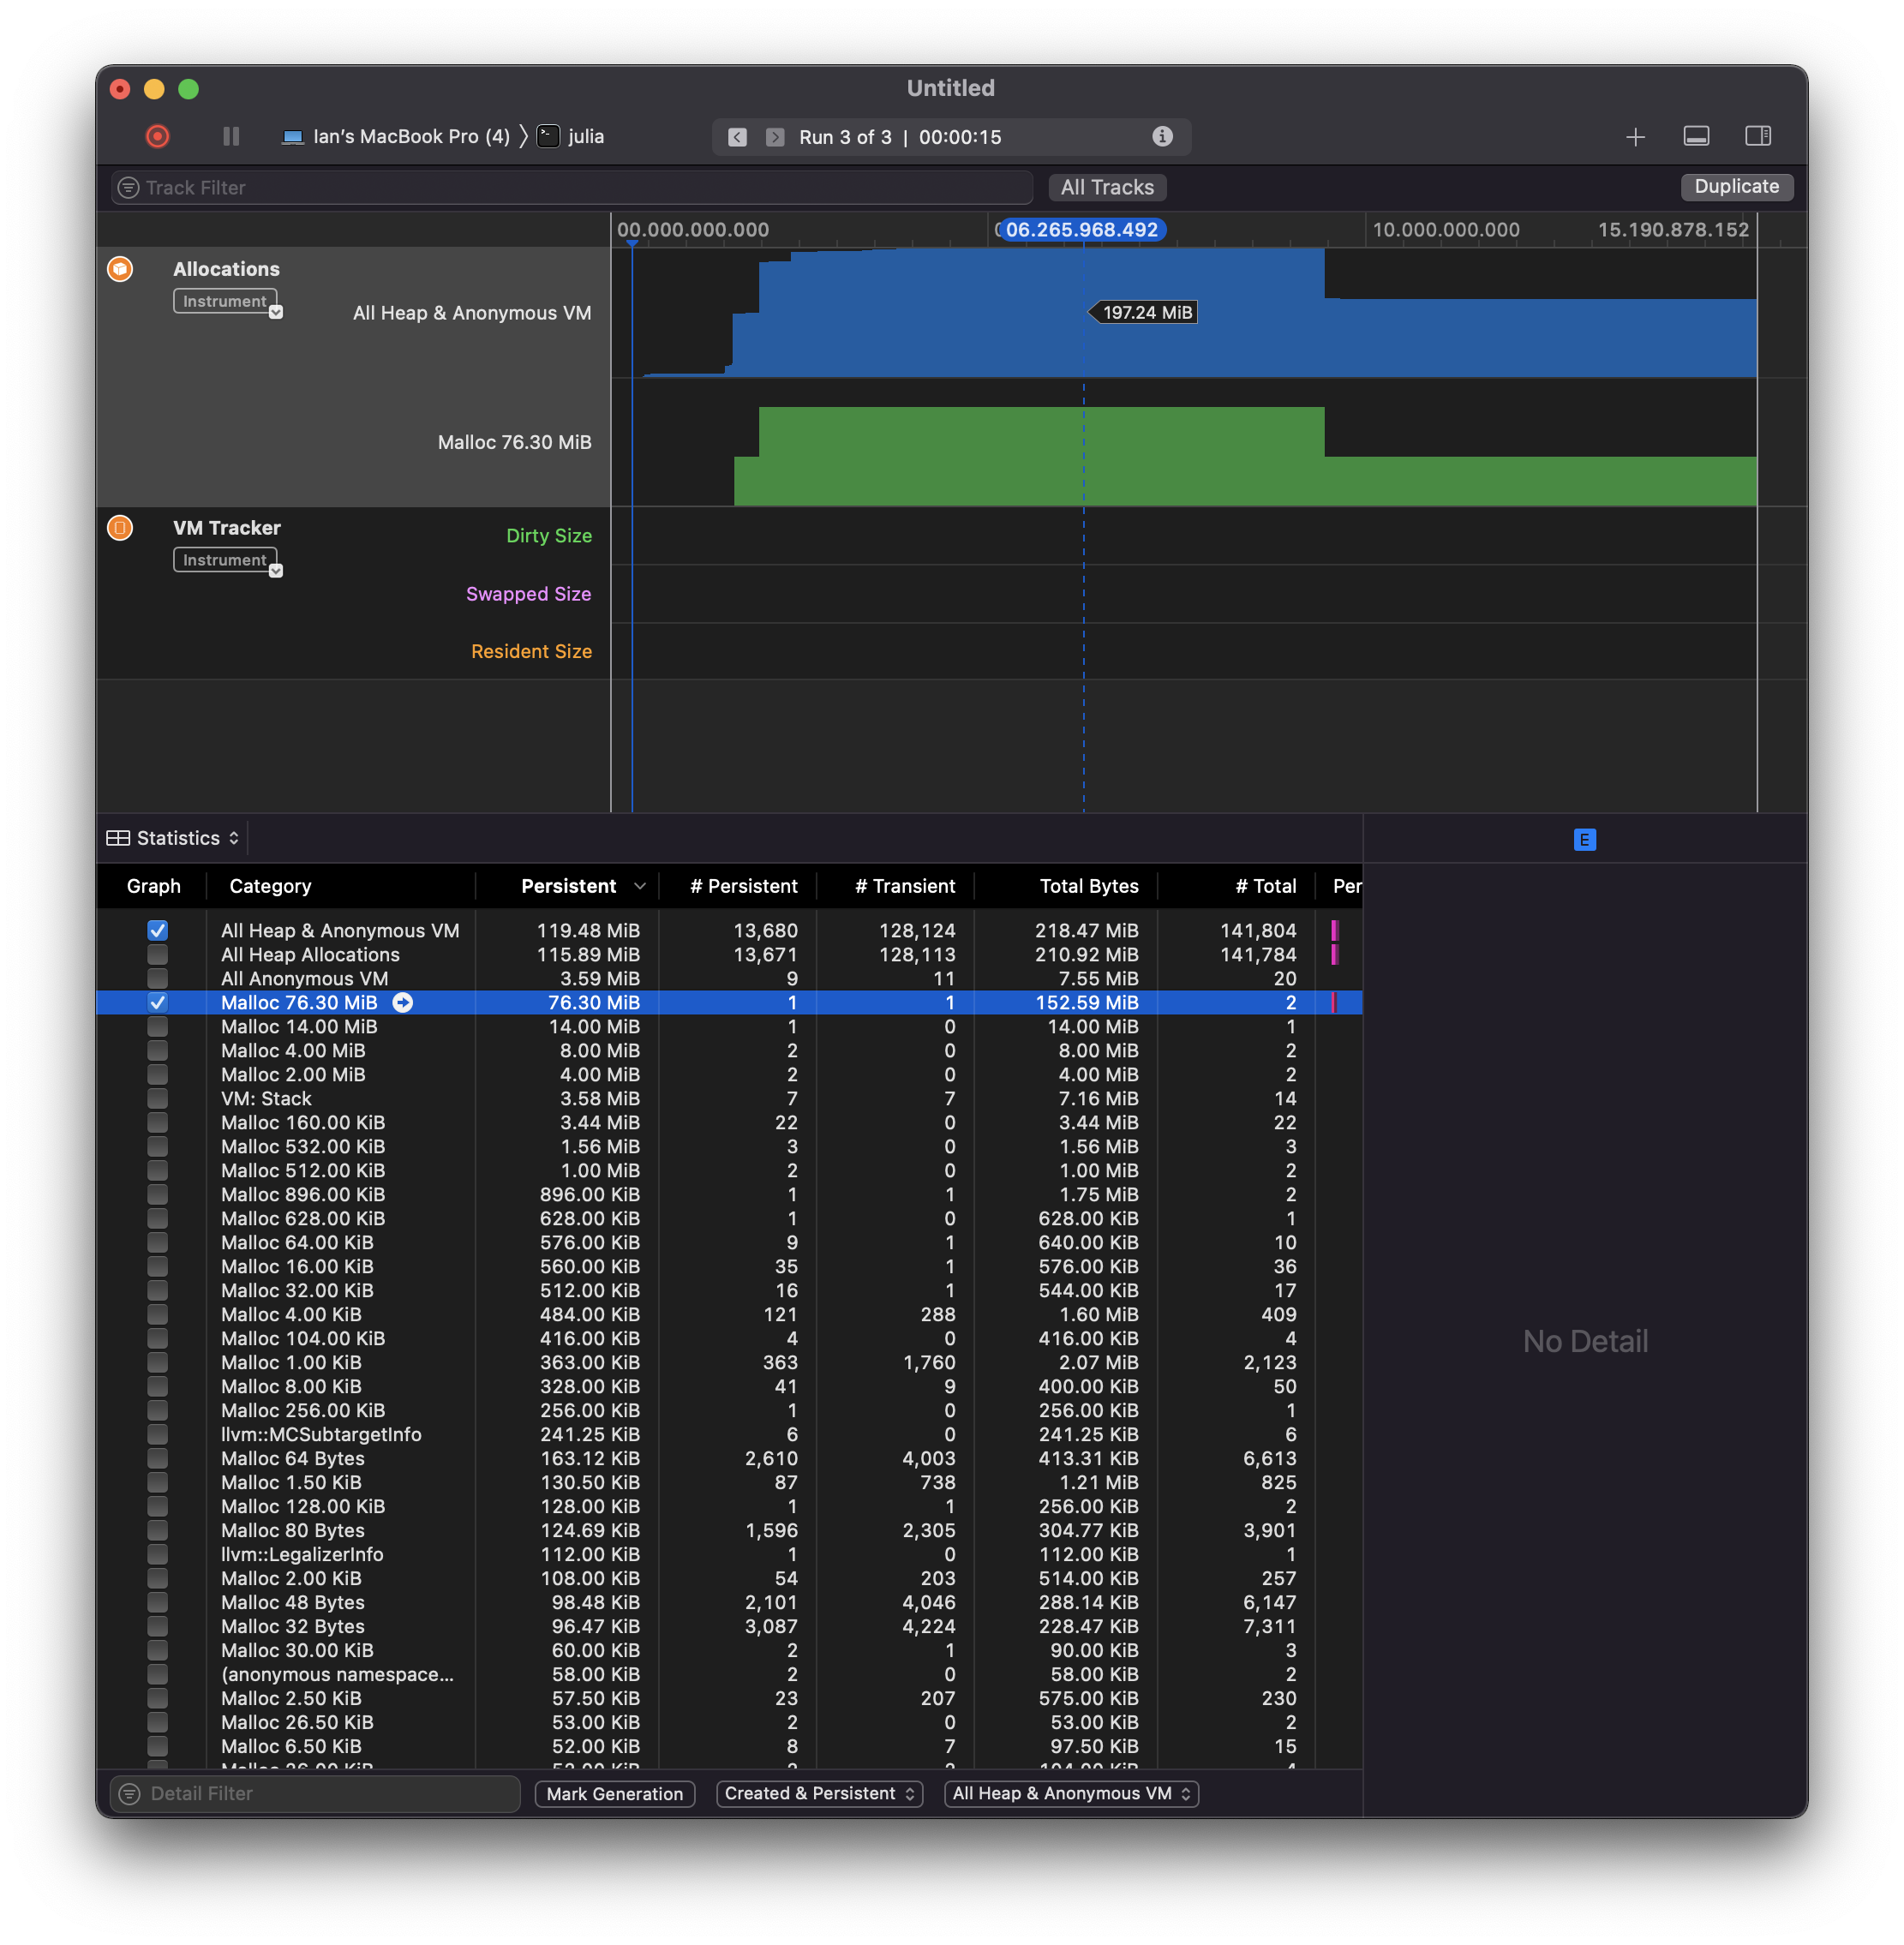
Given MacOS, this may either be a different issue, or the same issue but not glibc related
On Arch Linux, with 1.7.1 I get (based on your earlier examples):
melis@juggle 16:02:~/$ cat array.jl
# https://github.com/JuliaLang/julia/issues/42566#issuecomment-1028603528

function info(s)
    gc_live = Base.format_bytes(Base.gc_live_bytes())
    pid_mem = Base.format_bytes(parse(Int, strip(read(`ps -o rss= $(getpid())`, String))) * 1024)
    println("$(s) | gc_live = $(gc_live), pid_mem = $(pid_mem)");
    readline()
end

info("about to array alloc")
x = [zeros(10) for _ in 1:10^7];

info("about to run GC")
x = nothing
GC.gc(true)

info("about to exit")
melis@juggle 16:02:~/$ julia array.jl
about to array alloc | gc_live = 28.629 MiB, pid_mem = 199.867 MiB

about to run GC | gc_live = 1.417 GiB, pid_mem = 1.627 GiB

about to exit | gc_live = 1.749 MiB, pid_mem = 207.352 MiB
So could be a MacOS specific thing, as I don't see the large process size at exit on Linux?
https://github.com/JuliaLang/julia/issues/42566#issuecomment-1028587020 was on ubuntu (just clarified in the comment)
#42566 (comment) was on ubuntu (just clarified in the comment)
Okay, but I guess that was with much more extensive code than the simple array allocation above? And possibly multi-threaded? Seems good to reduce simple test cases, hence what I observed on Linux compared to your MacOS.
I was doing some reading and apparently macos is very lazy on returning memory to the kernel, if the memory pressure increases it does do it, but only then.
On an ARM ubuntu server the original OP sometimes shows that the OS hasn't requested the memory back, while other times it does get it back. I imagine it's different behaviour from the libcs.
On ubuntu doing ccall(:malloc_trim, Cvoid, (Cint,), 0) does make it release the memory back to the OS though.
Ok. Adding ccall(:malloc_trim, Cvoid, (Cint,), 0) to my Ubuntu CI run is not freeing up the memory. So something else is going on there. The code is heavily multithreaded, also uses CUDA, so clearly needs reduction.
Just cross-referencing, in my hunt for freeing more memory I learned the malloc_trim and it helped partly, it cleared some memory which has not been cleared before, but not everything. https://discourse.julialang.org/t/poor-performance-of-garbage-collection-in-multi-threaded-application/75493/18
This issue might be related to the behavior I reported on the discourse here:
https://discourse.julialang.org/t/determining-size-of-dataframe-for-memory-management/85277/36
MWE is from reading in and sub-sampling some big CSV files available from the Census:
using Pkg
Pkg.activate(".")

using CSV,DataFrames,Downloads,DataFramesMeta, StatsPlots, XLSX,
    Dates, Statistics, Turing, LinearAlgebra, Interpolations, Serialization,
    GLM, Colors, ColorSchemes


function getifnotthere(filename,URL)
    if !Base.Filesystem.ispath(filename)
        Downloads.download(URL,filename)
    end
end


getifnotthere("data/pums-2020-5yr-hus.zip","https://www2.census.gov/programs-surveys/acs/data/pums/2020/5-Year/csv_hus.zip")


if ! Base.Filesystem.ispath("data/psam_husa.csv") || ! Base.Filesystem.ispath("data/psam_husb.csv")
    cd("data")
    run(`unzip pums-2020-5yr-hus.zip`)
    cd("..")
end

psamh = let psamh = DataFrame()
    for i in ["a","b","c","d"]
        new = @select(CSV.read("data/psam_hus$(i).csv",DataFrame),:SERIALNO,:ST,:FINCP,:NP,:WGTP)
        @subset!(new,.!ismissing.(:FINCP) .&& .! ismissing.(:NP))
        psamh = [psamh ;
            new[wsample(1:nrow(new),new.WGTP,round(Int64,0.1*nrow(new))),:] ]
    end
    psamh
end
psamh.Year = tryparse.(Int64,psamh.SERIALNO[i][1:4] for i in 1:nrow(psamh))
At the end of this I have like 10GB of memory usage by the Julia process but varinfo() only knows about ~100MB of variables. Eventually systemd-oomd kills my session.
This issue might be related to the behavior I reported on the discourse here: https://discourse.julialang.org/t/determining-size-of-dataframe-for-memory-management/85277/36 MWE is from reading in and sub-sampling some big CSV files available from the Census:
See https://github.com/JuliaData/CSV.jl/issues/850