Numbering format ( .toLocaleString() ) is not working on label but working on yAxis. borderRadius also not working for all chart.
Hi John,
I try to format big numbers to have a separator based on my country (10000 to 10.000). With the same code, it works on yAxis, but seems to fail on label. I add Math.abs on formatter label to ensure that the code is working there.
Yes the Math.abs works to make it absolute positive, but the .toLocaleString() is just not working. I also tried to treat the params.value[1] as number by multiplying it. It works well.
I have tried to format the label with the same code in echarts as well and it works. It seemed the problem is when I applied the code onto R. Bellow I attach my code and the output.
a <- c("selesai", "belum selesai")
b <- c(-10000, 6000)

df <- data.frame(a , b)
echarts4r_issue <- df %>%
                   #chart
                   e_charts(x = a) %>%
                   echarts4r::e_bar(serie = b,
                                    legend = FALSE,
                                    barWidth = "50%",
                                    itemStyle = list(borderRadius = c("20", "10", "10", "10")),
                                    label = list(show = TRUE,
                                                 position = "outside",
                                                 formatter = htmlwidgets::JS("
                                                              function (params) {
                                                                return (Math.abs(params.value[1].toLocaleString('id-ID')));
                                                              }
                                                             "))
                              ) %>%
                              e_y_axis(show = TRUE,
                                       formatter = htmlwidgets::JS("
                                                    function (value, index) {
                                                      return (Math.abs(value).toLocaleString('id-ID'));
                                                    }
                                                  ")
                              ) %>%
                              e_x_axis (axisTick = FALSE) %>% # manual
                              e_tooltip(trigger = 'axis')

echarts4r_issue
{echarts4r} - fail on label, run well in yAxis (10.000)
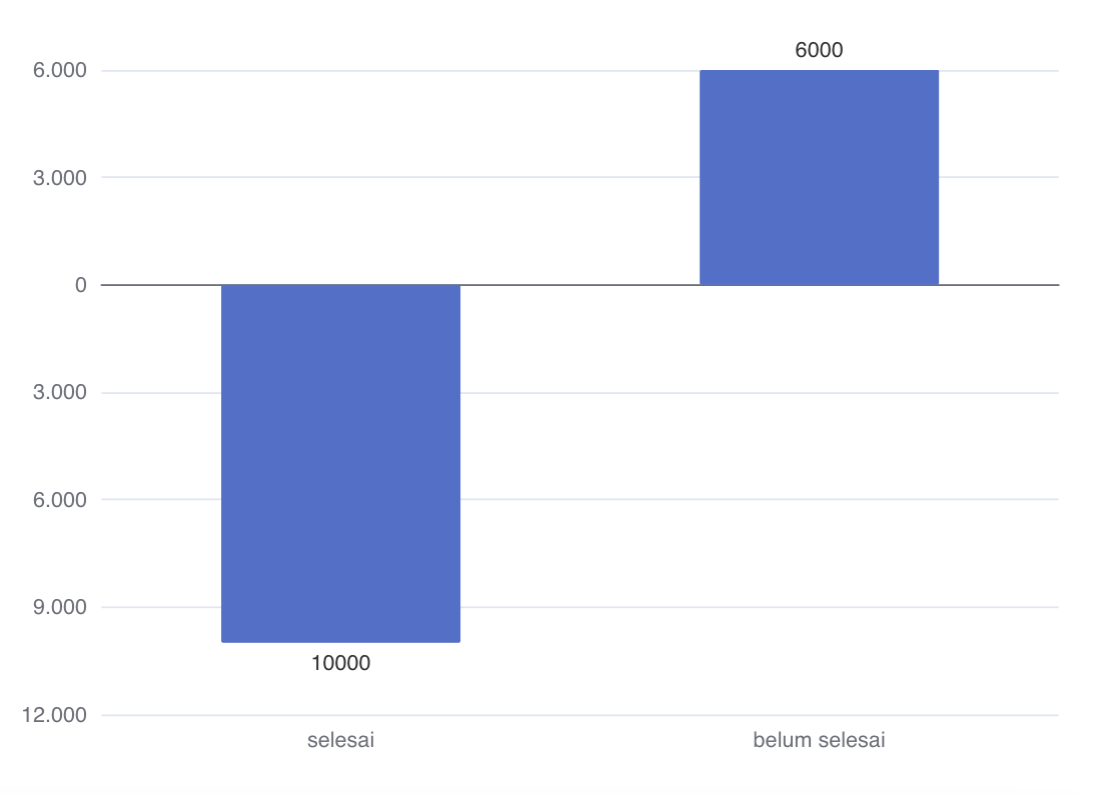
echarts - run well in label

I have another issue when formatting borderRadius in R. The output is inconsistent and sometimes not work at all. Same code works well on echarts

I think the functions you use in the echarts.js playground and echarts4r are different. E.g.: value vs. params.value.
Also it could be that echarts4r and the example used different data structures.
When creating a custom formatter it's good to log it so you exactly what params contains: (params) => {console.log(params); return 1;}
echarts4r label:
formatter = htmlwidgets::JS("
                       function (params) {
                         return (params.value[1].toLocaleString('id-ID'));
                        }
                    ")
echarts.js label:
formatter: function(params) {
  return params.value.toLocaleString('id-ID')
}
Both functions are the same. params and params.value. I use params.value[1] in echarts4r as your suggestion, [1] refers to yAxis. I remove the Math.abs
Can you give me example how to make the .toLocaleString('id-ID') works in label using my code above? Thank You
here are the two problems fixed
a <- c("selesai", "belum selesai")
b <- c(-10000.67, 6000.89)

df <- data.frame(a , b)
echarts4r_issue <- df %>%
	e_charts(x = a) %>%
	echarts4r::e_bar(serie = b,
          legend = FALSE,
          barWidth = "50%",
          itemStyle = list(borderRadius = c(20, 10, 10, 10)),
          label = list(show = TRUE,
	  position = "outside",
	  formatter = htmlwidgets::JS("
            function (params) { return Math.abs(params.value[1]).toLocaleString('id-ID'); }
          "))
	) %>%
	e_y_axis( formatter = htmlwidgets::JS("
	    function (value, index) { return Math.abs(value).toLocaleString('id-ID'); }
	  ")
	) %>%
	e_x_axis (axisTick = FALSE) %>% # manual
	e_tooltip(trigger = 'axis')

echarts4r_issue
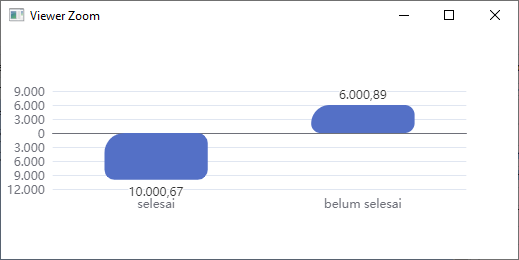
Thank you @helgasoft . It works well when we use Math.abs but isn't working when we remove the Math.abs. Specifically in label.The issue isn't found in yAxis.
Bellow, I remove the Math.abs. The label number formatting is not working
echarts4r_issue <- df %>%
                   #chart
                   e_charts(x = a) %>%
                   echarts4r::e_bar(serie = b,
                                    legend = FALSE,
                                    barWidth = "50%",
                                    itemStyle = list(borderRadius = c("20", "10", "10", "10")),
                                    label = list(show = TRUE,
                                                 position = "outside",
                                                 formatter = htmlwidgets::JS("

                                                              function (params) {
                                                                return params.value[1].toLocaleString('id-ID');
                                                              }
                                                              ")
                                                 )
                              ) %>%
                              e_y_axis(show = TRUE,
                                       formatter = htmlwidgets::JS("
                                                    function (value, index) {
                                                      return value.toLocaleString('id-ID');
                                                    }
                                                  ")
                              ) %>%
                              e_x_axis (axisTick = FALSE) %>% # manual
                              e_tooltip(trigger = 'axis')

echarts4r_issue
