can I create a pie-donut chart by e_pies?
what I would like to make is a pie donut chart that can show two equal(or subset) values in one pie chart functions such as arrange, does interconnect two values in two graphs, but I would like to see it on one graph. I've looked up for any examples or functions that could make this, but I couldn't find one. Really would appreciate any advice(maybe addtional JScode that could adjust this problem?)
You're looking for sunburst
Thank you for the advice But I think I failed to specify my intent well and confused you.
I want the total number of people in each group - in a pie the total number of woman in each group - in a donut
What I intend by doing this is, I would like to have the proportion of pie and donut different from each other, so that I could show clearly that, although the total number of group A is bigger than group B the higher proportion of Women in Group B is shown in a donut.
Sorry for the misleading request, Still grateful for the new function that I was not aware of!
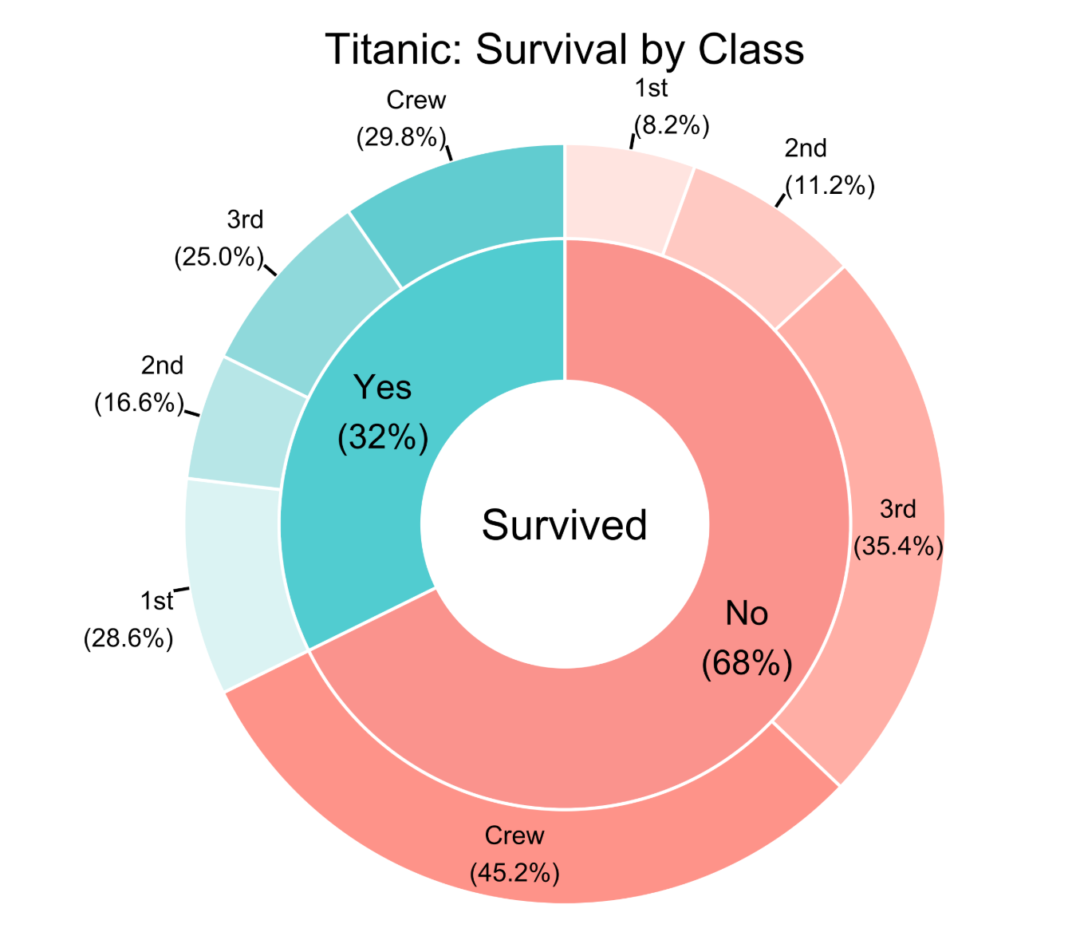
@20korando, are you trying to present the entire Titanic hierarchy like below?

If not, please provide some code (data, chart) and/or sketches of desired result.