Tooltip display on error-bars does now show data points correctly
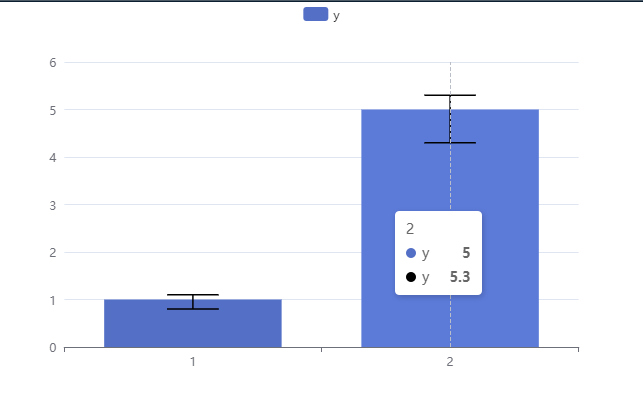
Hi, thanks for the continuous development of the package! I am trying to plot error bars with tooltip using your example, and the final output looks a bit werid. The lower bound does not come through and the upper bound is labelled as the main series name.
df <- data.frame(
  x = factor(c(1, 2)),
  y = c(1, 5),
  upper = c(1.1, 5.3),
  lower = c(0.8, 4.3)
)
df %>%
   e_charts(x) %>%
   e_bar(y) %>%
   e_error_bar(lower, upper) %>%
   e_tooltip(trigger = "axis")
Is there an easy way to make the tooltip display correct data using tooltip formatter? Thanks in advance!
here comes the fancy toolbar, JavaScript to the rescue. The data is there.
df <- data.frame(
	x = factor(c(1, 2)),
	y = c(1, 5),
	upper = c(1.1, 5.3),
	lower = c(0.8, 4.3)
)
df %>%
  e_charts(x) %>%
  e_bar(y) %>%
  e_error_bar(lower, upper) %>%
  e_tooltip(trigger = "axis", formatter=htmlwidgets::JS("
   	function(x) {        // console.log(x);  // use it to see contents of 'x'
   	  let d=x[1].value;
   	  let str='bar <b>'+x[0].value[1]+'</b><br>low <b>'+d[1]+'</b><br>high <b>'+d[2]+'</b>';
   	  return str;}"))
Can e_error_bar() also implement the bind argument? It adds more flexibility to the formatting of the tooltips and allows the addition of extra variable without the need of JS.
The TO-BE code looks something like this:
library(tidyverse)

df <- tibble(
  x = factor(c(1, 2)),
  y = c(1, 5),
  upper = c(1.1, 5.3),
  lower = c(0.8, 4.3),
  dummy = c(1, 2)
)

df %>%
  mutate(tt = paste0(
    "Renamed variable x: ", x, "<br />",
    "Renamed variable y: ", y, "<br />",
    "Lower bound: ", lower, "<br />",
    "Upper bound: ", upper, "<br />",
    "Additional variable: ", dummy
  )) %>%
  e_charts(x) %>%
  e_bar(y, bind = tt) %>%
  e_error_bar(
    lower,
    upper
    # , bind = tt
    # to-be implemented
  ) %>%
  e_tooltip(formatter = htmlwidgets::JS("
    function(params) {
      return params.name;
    }
  "))
The TO-BE output should have the error bar tooltip to be the same as the bar tooltip, which looks something like:

The idea comes from @swsoyee in #11.
smart code :+1:! - to eliminate complex JS. But, it looks like you want to assign a separate tooltip to the 3 lines of the error bar. Is this really necessary? To most people (bar + its err.bar) go together as one entity.
But, it looks like you want to assign a separate tooltip to the 3 lines of the error bar. Is this really necessary?
One might want to plot a error bar plot by itself.
Take the fabricated temperature data below:
library(tidyverse)
library(echarts4r)

set.seed(2021)

temperature <- tibble(
  hour = 1:24,
  upper = round(rnorm(24, 2 * sin((hour - 10) / 12 * pi) + 10, .5)),
  median = round(rnorm(24, upper - 5, .5)),
  lower = round(rnorm(24, upper - 10, .5)),
  dummy = sample(c("a", "b"), 24, replace = TRUE)
)

temperature %>%
  mutate(tt = paste0(
    "Upper Quartile: ", upper, "<br />",
    "Median: ", median, "<br />",
    "Lower Quartile: ", lower, "<br />",
    "Additional variable: ", dummy
  )) %>%
  e_charts(hour) %>%
  e_scatter(median, symbol_size = 11, bind = tt) %>%
  e_error_bar(lower, upper) %>%
  e_legend(show = FALSE) %>%
  e_title("Daily Temperature Quantile in 2020") %>%
  e_tooltip(formatter = htmlwidgets::JS("
    function(params) {
      return params.name;
    }
  "))
The tooltip only displays correctly when the hover is on the outer edge of the points:
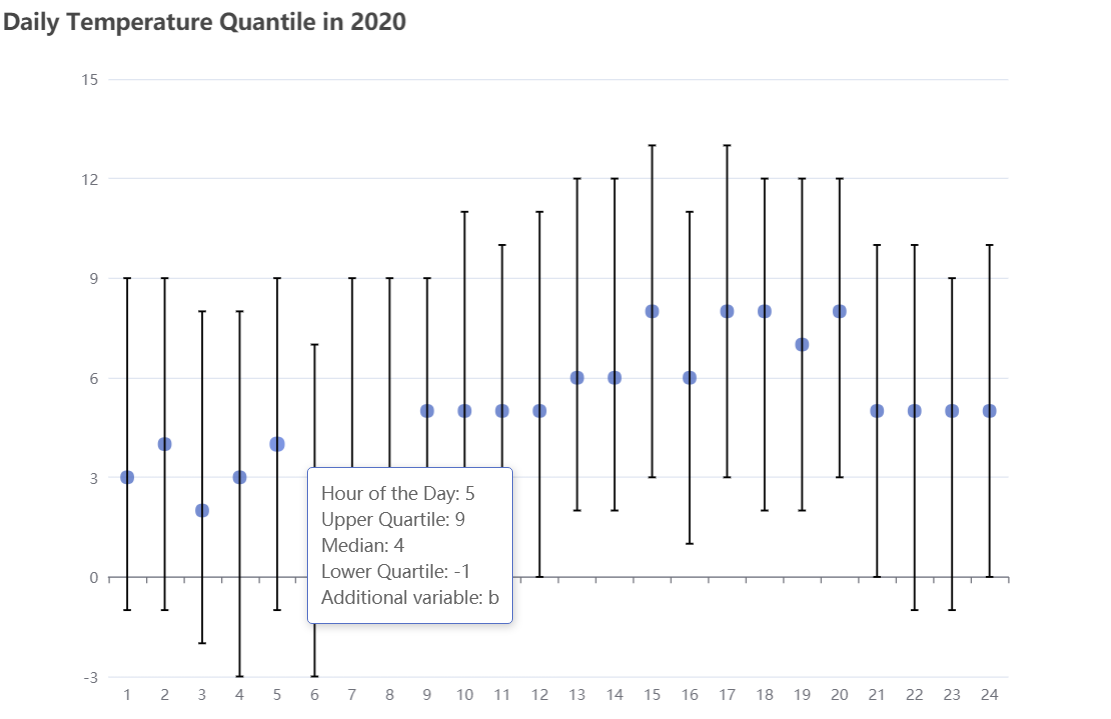
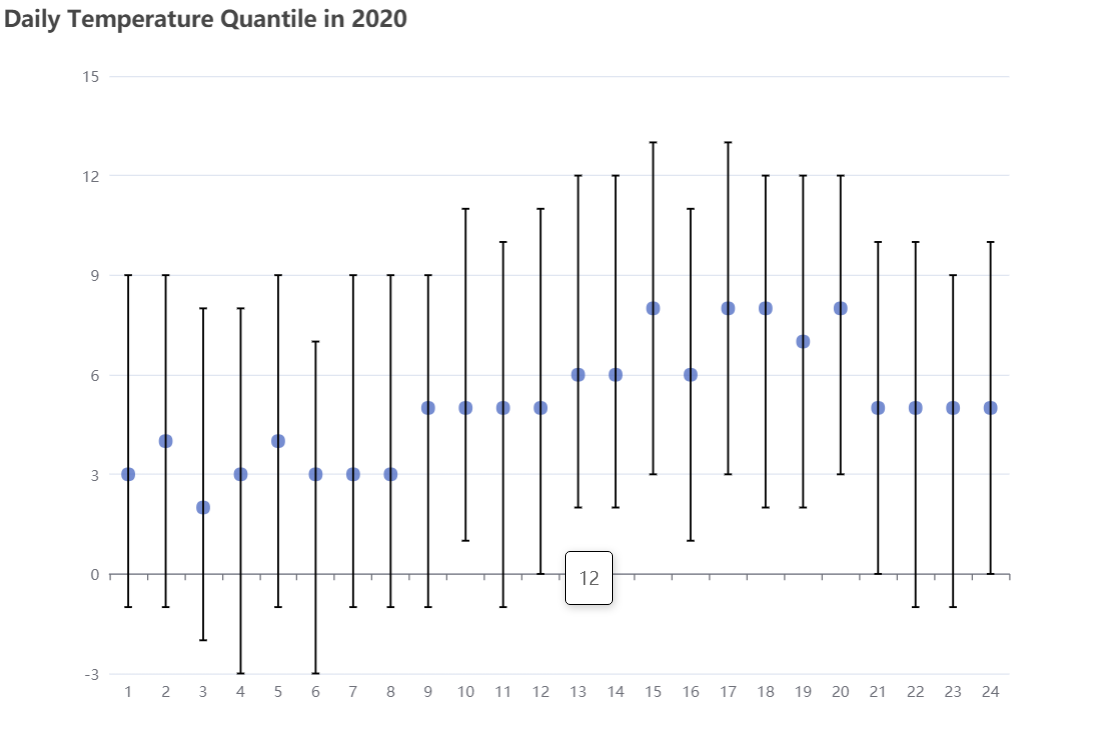
In such a quantile plot, normally, the median point is much smaller than the plot above
temperature %>%
  mutate(tt = paste0(
    "Hour of the Day: ", hour, "<br />",
    "Upper Quartile: ", upper, "<br />",
    "Median: ", median, "<br />",
    "Lower Quartile: ", lower, "<br />",
    "Additional variable: ", dummy
  )) %>%
  e_charts(hour) %>%
  e_scatter(median, symbol_size = 5, bind = tt) %>%
  e_error_bar(lower, upper) %>%
  e_legend(show = FALSE) %>%
  e_title("Daily Temperature Quantile in 2020") %>%
  e_tooltip(formatter = htmlwidgets::JS("
    function(params) {
      return params.name;
    }
  "))
Now the tooltip never displays properly, as it is impossible to hover over the points without having the cursor near the error bars. Implementing the bind argument for e_error_bar() definitely helps in a lot of situations.
Thank you for the detailed explanation. See your point, makes sense now.
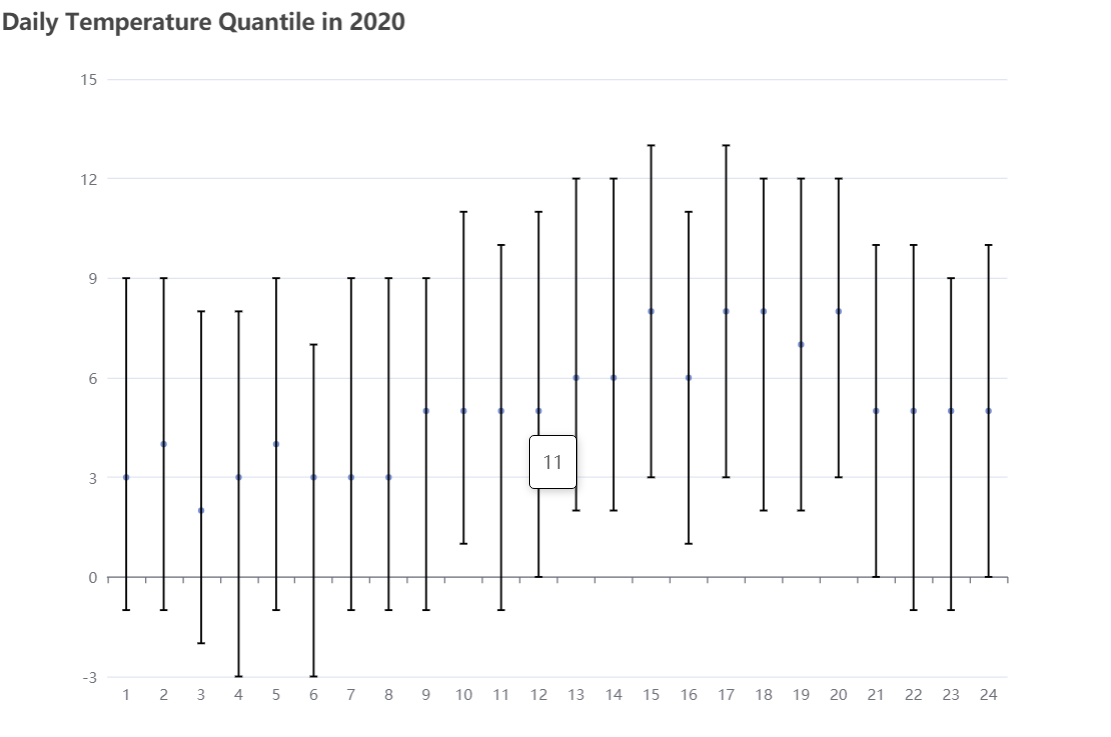
By setting a name to err.bar it becomes a separate entity and can have its own tooltip, but without the bar/scatter value (since it doesn't know it anyway).
That's the most you can get now without touching e_error_bar code.
library(tidyverse)
library(echarts4r)
set.seed(2021)
temperature <- tibble(
	hour = 1:24,
	upper = round(rnorm(24, 2 * sin((hour - 10) / 12 * pi) + 10, .5)),
	median = round(rnorm(24, upper - 5, .5)),
	lower = round(rnorm(24, upper - 10, .5)),
	dummy = sample(c("a", "b"), 24, replace = TRUE)
)

temperature %>%
	mutate(tt = paste0(
		"Hour of the Day: ", hour, "<br />",
		"Upper Quartile: ", upper, "<br />",
		"Median: ", median, "<br />",
		"Lower Quartile: ", lower, "<br />",
		"Additional variable: ", dummy
	)) %>%
	e_charts(hour) %>%
	e_scatter(median, symbol_size = 8, bind = tt) %>%
	e_error_bar( lower, upper,
		name='eb', tooltip=list(formatter = htmlwidgets::JS("
    function(x) {
   	  let d=x.value;
   	  let str='high <b>'+d[2]+'</b><br>low <b>'+d[1]+'</b>';
   	  return str;
    }
	"))
	) %>%
	e_legend(show = FALSE) %>%
	e_title("Daily Temperature Quantile in 2020") %>%
	e_tooltip(formatter = htmlwidgets::JS("
    function(params) { return params.name; }
  "))
Worked well. It looks like a tidy enough solution for me (in my context).