react-native-svg-charts
 react-native-svg-charts copied to clipboard
📈 One library to rule all charts for React Native 📊
Need different colors for positive and negative values.
Pie chart and BarCharts blinks while clicking the button in react-naive-svg-charts in android "react-native": "0.63.4" "react": "16.13.1", "react-native-svg-charts": "^5.4.0", I want to add text inside the line chart that indicates...

I am tying multiline chart with XAxis which should show the data labels as well. I need to show Data label value for Line chart and also for XAxis chart....
Added continuousLine props to line chart to skip null items in data. fixes: #468,
### What is the problem? I spent some time checking the documentation and the library API and I could not find a way to specify a X position on a...
I would like to know how to get the yAxis to show the logarithmic scale such as 10^1, 10^2, 10^3 instead of numbers from 10 to 1000. How is it...
Currently, the `Path` component generates warnings like these on web: ``` Warning: Received `false` for a non-boolean attribute `animate`. If you want to write it to the DOM, pass a...
Hi, is it possible to show a range of values in yAxis as multiples of 5 shown on the screenshot below? Required YAxis 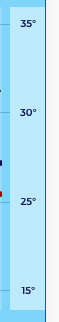...
I am trying to add a vertical line next to my YAxis  so far I have all the horizontal lines, but how do I...
### What is the problem? ### When does it happen? ### What platform? - [x] iOS - [x] Android react-native version: `40.0.1` react-native-svg-charts version: `5.4.0` react-native-svg version: `12.1.0` ### Code...
Metadata
Owner
Metadata
📈 One library to rule all charts for React Native 📊