How to change x-axis and y-axis values
What is the problem?
Hi, i am using this module it's working fine. But my question is how to change the x-axis values and y-axis values in Bar-Chart.
Initially takes x-axis values are 0,1,2,3,4------
Initially takes y-axis values are -80,-60,-40,-20,0,20,40-----
What platform?
- [x] iOS
- [x] Android React Native version: 0.56.1
Code to reproduce
import React from 'react'
import { Grid, LineChart, XAxis, YAxis, BarChart } from 'react-native-svg-charts'
import { View, Text as RNText } from 'react-native'
import { Text } from 'react-native-svg'
class XYAxisBarChart extends React.PureComponent {
render() {
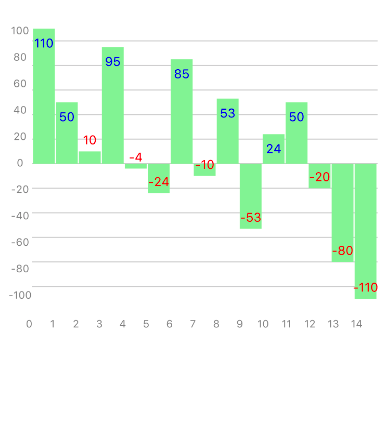
const data = [110, 50, 10, 95, -4, -24, 85, -10, 53, -53, 24, 50, -20, -80, -110]
const axesSvg = { fontSize: 10, fill: 'grey' }
const verticalContentInset = { top: 10, bottom: 10 }
const xAxisHeight = 30
const CUT_OFF = 20
const Labels = ({ x, y, bandwidth, data }) =>
data.map((value, index) => {
return (
<Text
key={index}
x={x(index) + bandwidth / 2}
y={value < CUT_OFF ? y(value) - 10 : y(value) + 15}
fontSize={12}
fill={value >= CUT_OFF ? 'blue' : 'red'}
alignmentBaseline={'middle'}
textAnchor={'middle'}
>
{value}
</Text>
)
})
return (
<View style={{ flex: 1, padding: 10 }}>
<View style={{ height: 300, flexDirection: 'row' }}>
<YAxis data={data} style={{ marginBottom: 0 }} contentInset={verticalContentInset} svg={axesSvg} />
<View style={{ flex: 1 }}>
<BarChart
style={{ flex: 1 }}
data={data}
contentInset={{ top: 20, bottom: 20 }}
svg={{
fill: 'lightgreen'
}}
>
<Grid />
<Labels />
</BarChart>
</View>
</View>
<XAxis style={{ marginHorizontal: -10, height: 30 }} data={data} formatLabel={(value, index) => index} svg={axesSvg} contentInset={{ left: 30, right: 30 }} />
</View>
)
}
}
export default XYAxisBarChart
Here is my screenshot:-
If you want a different output in your axis, you would give a different function for the formalLabel property.
What do you want to change them to?
To Change X and Y axis value use object to store the data:
import React from 'react'; import {SafeAreaView, StyleSheet, ScrollView, View} from 'react-native'; import {BarChart, Grid, XAxis, YAxis} from 'react-native-svg-charts'; import * as scale from 'd3-scale'; import {Text} from 'react-native-svg'; class App extends React.Component { render() { const data = [ { value: 50, labelX: 'A', labelY: 'One', }, { value: 10, labelX: 'B', labelY: 'Two', }, { value: 40, labelX: 'C', labelY: 'Three', }, { value: 95, labelX: 'D', labelY: 'Four', }, { value: 85, labelX: 'E', labelY: 'Five', }, ];
const CUT_OFF = 20;
const Labels = ({x, y, bandwidth, data}) =>
  data.map((item, index) => (
    <Text
      key={index}
      x={x(index) + bandwidth / 2}
      y={item.value < CUT_OFF ? y(item.value) - 10 : y(item.value) + 15}
      fontSize={14}
      fill={item.value >= CUT_OFF ? 'white' : 'black'}
      alignmentBaseline={'middle'}
      textAnchor={'middle'}>
      {item.value}
    </Text>
  ));

return (
  <>
    <SafeAreaView>
      <ScrollView
        contentInsetAdjustmentBehavior="automatic"
        style={styles.scrollView}>
        <View style={{flexDirection: 'row', height: 200}}>
          <View style={{width: 50, flexDirection: 'column'}}>
            <YAxis
              data={data}
              scale={scale.scaleBand}
              svg={{
                fill: 'grey',
                fontSize: 20,
              }}
              style={{flex: 1}}
              min={0}
              yAccessor={({index}) => index}
              formatLabel={(_, index) => data[index].labelY}
            />
            <View style={{flex: 0.1}} />
          </View>

          <View style={{flex: 1, flexDirection: 'column'}}>
            <BarChart
              style={{flex: 1}}
              data={data}
              gridMin={0}
              yAccessor={({item}) => item.value}
              svg={{fill: 'rgb(134, 65, 244)'}}>
              <Labels />
              <Grid direction={Grid.Direction.HORIZONTAL} />
            </BarChart>
            <XAxis
              data={data}
              scale={scale.scaleBand}
              svg={{
                fill: 'grey',
                fontSize: 20,
              }}
              min={0}
              style={{flex: 0.1}}
              yAccessor={({index}) => index}
              formatLabel={(_, index) => data[index].labelX}
            />
          </View>
        </View>
      </ScrollView>
    </SafeAreaView>
  </>
);
} }
const styles = StyleSheet.create({ scrollView: { backgroundColor: '#f9f9f9', padding: 10, }, });
export default App;
TEXT IS CREATING ISSUE WITH NORMAL TEXT FROM REACT-NATIVE