Color-Graph
 Color-Graph copied to clipboard
client-side color graph library
ColorGraph.js
A color graph is a color palette arranged in an undirected, weighted graph. see more info on this concept here: http://brandmark.io/color-wheel/discussion/
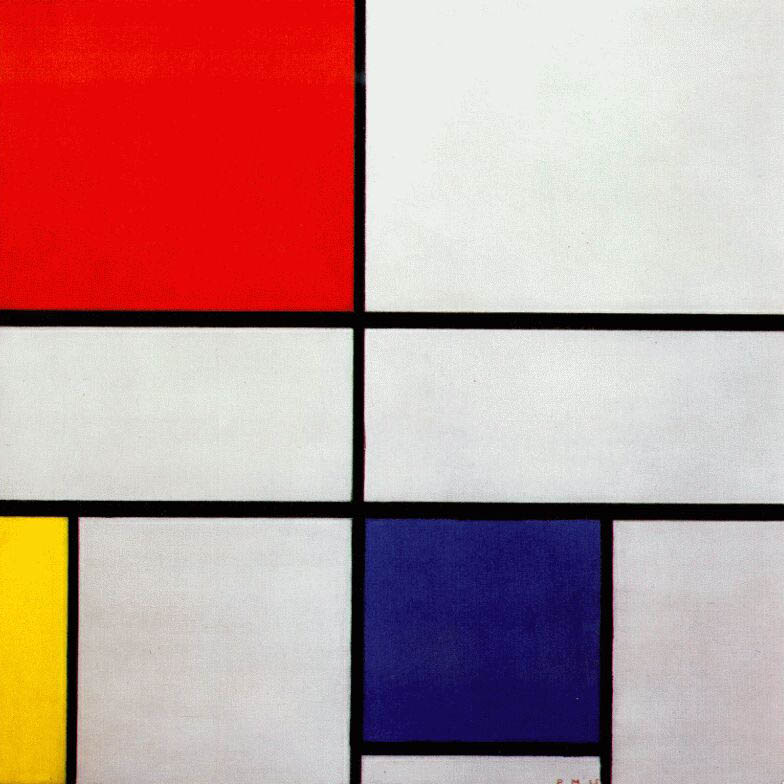 to ->>>
colorgraph.js takes an <img> and extracts its color graph. The result is a color palette and an adjacency matrix
this library is meant for use on browsers, and requires the color quantization library RgbQuant (can work on node.js as well, but will require the node-canvas library)
usage:
1: quantize an image
// img: html <img> element
// num: number of colors to quantize into
// use_mode: Boolean, smooth the image using the mode of a 3x3 bucket (removes spurious 1px adjacency noise caused by down-scale sharpening)

quantized = colorgraph.quantize(img,num,use_mode)

{
    palette: [...], // quantized RGB palette
    out: {...}, // quantized datastructure from RgbQuant
    canvas: {...}, // quantized canvas for display
    sizes: [...] // normalized area of each color in palette
}
2: get color adjacency matrix (this is the node connectivity matrix that defines the graph)
// palette: input RGB palette
// canvas: canvas containing the image
// normalize: Boolean, normalize the adjacency matrix with respect to image perimeter size (for comparing the adjacency matrix of different sized images)

adjacency = colorgraph.get_connectivity_matrix(quantized.palette, quantized.canvas, normalize)

// row-major adjacency matrix (ith row = ith palette color)
[
[...]
[...]
[...]
]
3: ColorWheel API (optional) feel free to use my colorization API, free for non-commercial projects
// model: 'dribbble', 'nes', 'soviet', 'anime', 'animation', 'pixelart', 'poster', 'painting'
// invert: if false, returned palette will be sorted by luminance
// num: number of palettes to return

var data = {
    model: 'dribbble',
    quantized: { sizes: quantized.sizes, palette: quantized.palette, adjacency: adjacency },
    invert: true,
    num: 1
};

// 0 <= hue <= 1
if(hue >= 0){
    data.hue = hue;
}

// 0 <= saturation <= 1
if(saturation >= 0){
    data.saturation = saturation;
}

$.ajax({
  type: "POST",
  url: 'http://brandmark.io/color-wheel/api/',
  data: {input: JSON.stringify(data)},
  success: function(results){
        colorgraph.colorize(img, target_canvas, quantized, results[0]);
  },
  dataType: 'json'
});
4: Colorize image
apply new colors to <canvas> for display purposes
// img: source <img>
// canvas: <canvas> to draw to
// quantized: quantized object from quantize()
// palette: new RGB palette to draw

colorgraph.colorize(img, canvas, quantized, palette);