Toxic is power-hungry / polling / CPU wake-ups
According to powertop, it causes more power draw than Firefox with ~7 tabs open :)
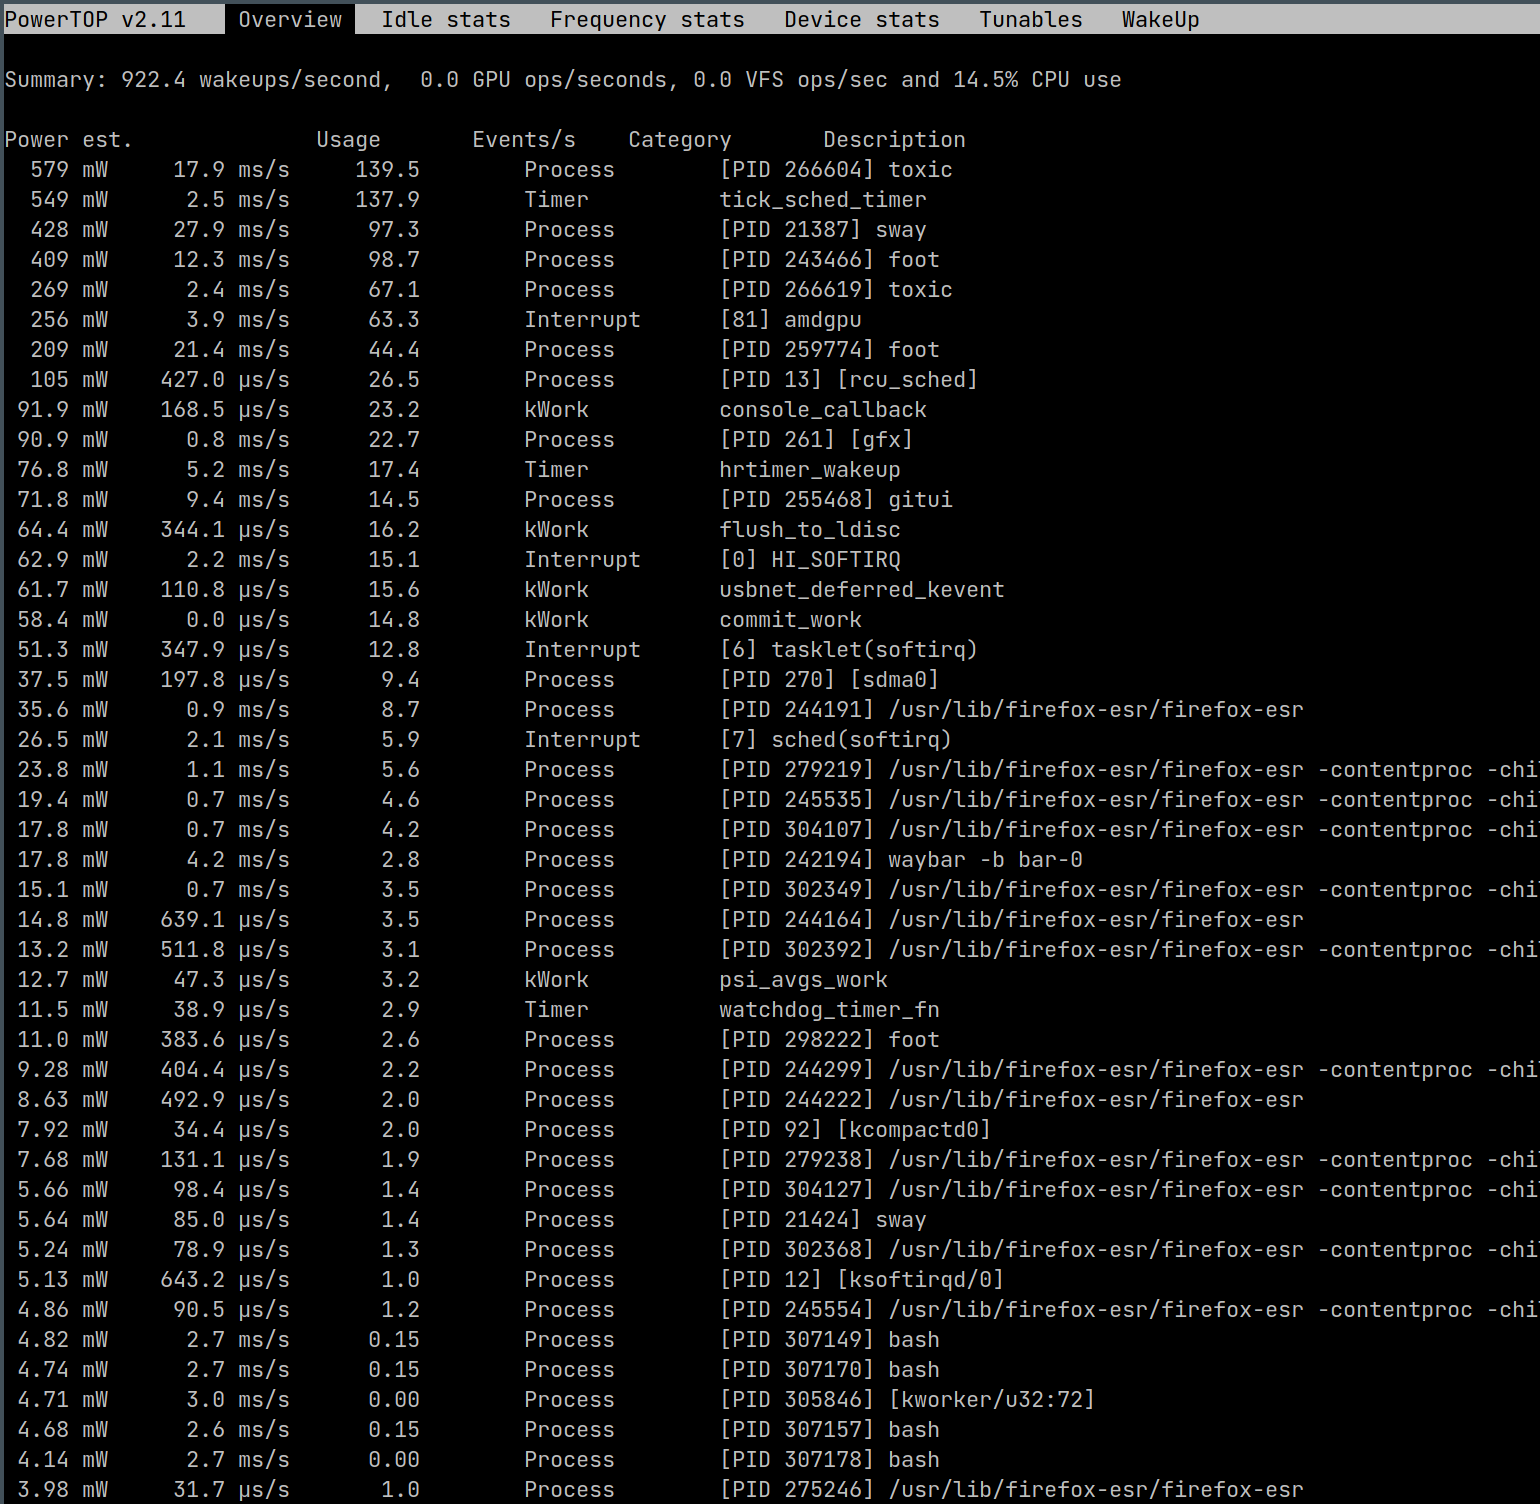
Is there anything that can be done to it? For example, detect when application has no focus and pause or defer some calls.
Have you tried comparing Toxic to other clients such as qTox and uTox? This might just be the DHT's fault. If that's the case, you could probably reduce it by running Toxic in TCP only mode, which removes your client from the DHT.
edit: Also I noticed in the mentioned topic above that you compile with custom flags. Does compiling with default flags help?
Using default flags made no difference. Will compare to qTox and report back.
could probably reduce it by running Toxic in TCP only mode
Could you point at specific property/config? I've briefly looked at toxic.conf and can't immediately see anything related. toxic_profile.tox is a binary and DHTnodes.json seems to be dynamically-generated with some initial pre-seed.
Could you point at specific property/config?
You just run toxic with the -t option. You can see all the options with toxic --help
Unfortunately, there is still a constant ~1.3% of CPU usage. This is on 12-vcore CPU, launched as ./toxic -t -L -4.
@savchenko can you tell us what activites you are doing with toxic while this happens? just on idle running toxic? or do you have large groups active? video calling? filetransfers? or lots of online friends? how powerful / slow is your laptop? any details may help.
@zoff99 , absolutely! Would you benefit from a certain tcpdump as well?
- Lenovo X13, AMD 4650U, 16Gb RAM, 512Gb NVMe.
- Flashed with the latest v1.30 UEFI F/W, EFI with SecureBoot enabled.
- Debian Bullseye, SMP kernel v5.10.28-1
- Complete cmdline, although I see no difference compared to the default
ro quiet:ro quiet kaslr apparmor=1 security=apparmor ipv6.disable=1 kernel.kptr_restrict=2 slab_nomerge mce=0 page_alloc.shuffle=1 mitigations=auto audit=0 efi=disable_early_pci_dma init_on_alloc=1 debugfs=off init_on_free=0 pti=auto vsyscall=none extra_latent_entropy amd_iommu=on fsck.mode=force fsck.repair=preen kernel.kexec_load_disabled=1 module.sig_enforce=1 - DHCP via Ethernet, 1Gbps.
- versions:
Toxic version 0.10.1 Toxcore version 0.2.12 - Single user in contact list.
- No active calls or file transfers.
- extra-quick strace with the default parameters:
sudo -E strace -c toxic % time seconds usecs/call calls errors syscall ------ ----------- ----------- --------- --------- ------------------- 67.54 0.143451 263 544 clock_nanosleep 6.97 0.014809 7 1857 6 ioctl 5.37 0.011405 10 1094 clock_gettime 4.82 0.010235 6 1635 getrandom 4.70 0.009979 13 743 544 recvfrom 4.13 0.008763 12 714 224 sendto 1.75 0.003721 9 381 mmap 1.14 0.002412 9 268 128 openat 0.73 0.001551 8 176 close 0.53 0.001122 9 120 mprotect 0.47 0.001008 8 119 read 0.37 0.000785 7 111 fstat 0.23 0.000498 9 51 5 futex 0.19 0.000407 10 38 1 socket 0.19 0.000402 8 46 16 stat 0.15 0.000317 21 15 15 connect 0.14 0.000298 7 40 recvmsg 0.07 0.000143 6 21 bind 0.06 0.000131 11 11 9 access 0.06 0.000117 5 20 getsockname 0.05 0.000104 8 13 brk 0.04 0.000093 4 22 fcntl 0.04 0.000087 7 12 rt_sigaction 0.03 0.000071 23 3 readlink 0.03 0.000069 17 4 write 0.03 0.000066 16 4 getdents64 0.02 0.000049 9 5 getpid 0.02 0.000048 9 5 munmap 0.02 0.000041 10 4 setsockopt 0.02 0.000040 5 8 clone 0.02 0.000039 7 5 getuid 0.01 0.000030 7 4 lseek 0.01 0.000028 9 3 3 mkdir 0.01 0.000016 16 1 memfd_create 0.01 0.000014 4 3 rt_sigprocmask 0.01 0.000013 13 1 ftruncate 0.01 0.000012 12 1 sched_setscheduler 0.00 0.000010 10 1 dup3 0.00 0.000009 9 1 umask 0.00 0.000009 9 1 arch_prctl 0.00 0.000007 7 1 geteuid 0.00 0.000000 0 1 execve 0.00 0.000000 0 1 gettimeofday 0.00 0.000000 0 2 2 statfs 0.00 0.000000 0 1 set_tid_address 0.00 0.000000 0 1 set_robust_list 0.00 0.000000 0 1 pipe2 0.00 0.000000 0 1 prlimit64 ------ ----------- ----------- --------- --------- ------------------- 100.00 0.212409 26 8114 953 total toxic.confwith the comments removed:ui = { timestamps=true; alerts=true; bell_on_message=true; bell_on_filetrans=true; bell_on_filetrans_accept=true; bell_on_invite=true; native_colors=true; color_bar_bg="black"; color_bar_fg="white"; color_bar_accent="cyan"; color_bar_notify="yellow"; autolog=false; time_format=24; timestamp_format="%H:%M"; show_typing_other=true; show_typing_self=true; show_welcome_msg=false; show_connection_msg=true; nodeslist_update_freq=1; autosave_freq=300; history_size=700; notification_timeout=6000; line_join="-->"; line_quit="<--"; line_alert="-!-"; line_normal="-"; mplex_away=false; mplex_away_note="Away" }; audio = { conference_audio_channels=1; chat_audio_channels=1; push_to_talk=false; }; tox = { download_path="/home/user/Downloads/tox"; }; sounds = { error="__DATADIR__/sounds/ToxicError.wav"; user_log_in="__DATADIR__/sounds/ToxicContactOnline.wav"; user_log_out="__DATADIR__/sounds/ToxicContactOffline.wav"; call_incoming="__DATADIR__/sounds/ToxicIncomingCall.wav"; call_outgoing="__DATADIR__/sounds/ToxicOutgoingCall.wav"; generic_message="__DATADIR__/sounds/ToxicRecvMessage.wav"; transfer_pending="__DATADIR__/sounds/ToxicTransferStart.wav"; transfer_completed="__DATADIR__/sounds/ToxicTransferComplete.wav"; }; keys = { next_tab="Ctrl+p"; prev_tab="Ctrl+o"; scroll_line_up="Ctrl+k"; scroll_line_down="Ctrl+j"; half_page_up="Ctrl+e"; half_page_down="Ctrl+y"; page_bottom="Ctrl+g"; toggle_peerlist="Ctrl+l"; toggle_paste_mode="Ctrl+t"; };
Before we spend any more time trying to find a bug in toxic that might not even exist we need to know if this is a toxic issue or a core issue by checking if at least one other client has the same problem.
If we determine that it's an issue with toxic, the next step would be determining if it's coming from the interface, networking etc. You could try running toxic with networking disabled (via the -o option) to see if that changes anything. You could also try running with LAN disabled (-L) to rule out a local network issue.
Well, I was launching with -L in https://github.com/JFreegman/toxic/issues/564#issuecomment-820867644. Adding -o doesn't help much, CPU usage steadily floats around ~1.3%. I have single user in my contact list and they are offline. I have removed the config and it made no difference.
Perhaps errors in futex and openat worth looking into?
% time     seconds  usecs/call     calls    errors syscall
------ ----------- ----------- --------- --------- -------------------
  7.30    0.011619          21       540       152 futex
  1.14    0.001814           6       274       129 openat
  0.14    0.000225           5        39        17 stat
  0.06    0.000103           9        11         9 access
  0.37    0.000585           5        98         6 ioctl
  0.04    0.000058          14         4         4 connect
  0.01    0.000013           4         3         3 mkdir
  0.00    0.000000           0         2         2 statfs
  0.03    0.000045           7         6         1 socket
  0.01    0.000008           8         1         1 sendto
Attaching to the running process:
$ sudo strace -e futex,access,stat,openat -p 24648
strace: Process 24648 attached
--- SIGWINCH {si_signo=SIGWINCH, si_code=SI_KERNEL} ---
futex(0x5d52929a0628, FUTEX_WAIT_PRIVATE, 2, NULL) = -1 EAGAIN (Resource temporarily unavailable)
futex(0x5d52929a0628, FUTEX_WAKE_PRIVATE, 1) = 0
futex(0x5d52929a0628, FUTEX_WAIT_PRIVATE, 2, NULL) = -1 EAGAIN (Resource temporarily unavailable)
futex(0x5d52929a0628, FUTEX_WAKE_PRIVATE, 1) = 0
futex(0x5d52929a0628, FUTEX_WAKE_PRIVATE, 1) = 0
--- SIGWINCH {si_signo=SIGWINCH, si_code=SI_KERNEL} ---
futex(0x5d52929a0628, FUTEX_WAIT_PRIVATE, 2, NULL) = 0
futex(0x5d52929a0628, FUTEX_WAKE_PRIVATE, 1) = 0
futex(0x5d52929a0628, FUTEX_WAIT_PRIVATE, 2, NULL) = -1 EAGAIN (Resource temporarily unavailable)
Any chance these "Resource temporarily unavailable" can shed some light on the underlying issue?
I noticed this high CPU load/battery usage issue as well. To figure out what's going on, I ran toxic -o in a profiler for about 2 minutes and just let it sit there. That showed that it is calling draw_active_window() a lot. During that time, it called that function 3055 times (or about 25 times per second) - while calling it just once would have been enough, since the whole time nothing changed on screen. To avoid this, it should probably only redraw the screen if something actually has changed, instead of running a busy loop redrawing the screen every couple of milliseconds.
I then tried to reduce the effect of those calls by introducing a huge 1 second delay in the redraw thread by inserting a sleep(1) call. Of course this is not an actual fix, but merely a way to temporarily stop this part of the code from consuming many CPU cycles, so that other parts of the code consuming CPU time become more visible. This lead to a decrease of the CPU load to less than half of what it was before. I then profiled toxic once more.
From that profiler run it looks like quite a bit of time is also spent in audio related code. Again, toxic was idle the whole time.
So I then re-compiled toxic with make DISABLE_AV=1 DISABLE_SOUND_NOTIFY=1.
This further reduced the CPU load on my machine from originally around 3 % to less than 0.2 %. I did not investigate the audio related code any further, but I noticed that compiling toxic with just make DISABLE_AV=1 did not significantly reduce the CPU load.
Running toxic without the -o option slightly increases the CPU load, but it is still a lot less than it initially was.
It appears, with the latest version the CPU load issue got even worse. I'm seeing around 7 % load with version 0.11.1 up from ~3 % when I last checked. This hurts battery life quite substantially.
@jhe2 Can you test this branch and tell me how it works please? https://github.com/JFreegman/toxic/tree/window_refresh
@JFreegman Sure, from a quick test, CPU load is down to ~2 % with that branch and all default compile options. With make DISABLE_AV=1 DISABLE_SOUND_NOTIFY=1 it is at about 1.3 %. So quite an improvement.
@JFreegman Sure, from a quick test, CPU load is down to ~2 % with that branch and all default compile options. With
make DISABLE_AV=1 DISABLE_SOUND_NOTIFY=1it is at about 1.3 %. So quite an improvement.
Great. I'll do some more thorough testing tomorrow and get it merged once I'm satisfied with it.
As far as AV causing CPU issues, that might be a core issue. I'll look into it.
Changes have been merged: https://github.com/JFreegman/toxic/commit/f3f81111c814e148aa090f92247d7f4d88b0c25e https://github.com/JFreegman/toxic/commit/1803da85c1f385ac6d68ea3b48078bca7a838ad1
This is basically a hack over top of toxic's already hacky interface. All it does is flag the window redraw functions every time an event occurs that changes something on the interface, rather than spamming the functions x times per second. Toxic was doing a lot of unnecessary redrawing, so this should be a huge improvement.
Since there isn't a centralized part of the code where we can detect such events, I basically had to list out every event and make sure they're covered. So don't be surprised if you run into a bug here and there.
Edit: I'm realizing now that the reason the problem got worse with the latest changes is because I increased the refresh rate for the game module. I'm currently looking into having it dynamically set.
Edit 2: Done: https://github.com/JFreegman/toxic/commit/b7002ef3f08bdd6ca761e07f5987bbf4a74ce325 This should significantly reduce CPU usage further, particularly when the window is being updated a lot (e.g. during a file transfer, audio call etc.)
@jhe2 What happens if you add an extra zero to the sleep value on this line: https://github.com/JFreegman/toxic/blob/master/src/notify.c#L321
This polls for sound notifications 10 times per second instead of 100 times per second.
Everything appears to be working normally. CPU load is down a little, from ~ 2% to about 1.4 %.
Merged: https://github.com/JFreegman/toxic/commit/3fddc410b3620a009f77f7b8fe35b02e10b11b68
I don't think there's anything I can do about AV resource usage client-side because the main loop occurs inside the toxav_iterate() loop, the speed of which is set by toxcore. I'm going to close this issue now as the bulk of the problem seems to have been resolved.
Actually, there is still some code related to AV devices that I haven't looked at. Going to reopen this until I can get a chance to look over that part of the code.