Save and load options of the viewer
Is there a way to save/load options of the viewer?
Example: I manually manipulate the histogram curve, and the color palette of a viewer instance for a particular image.
Can I save those modifications to a python args variable, i.e. viewer_options=[camera=x, color=y, ..] and then initialize the viewer with those:
itkwidget.view(image, viewer_options)
This would allow to control the default view when presenting in binder, or similar.
Is it what you want?
viewer = view(image, units=units, select_roi=True)
viewer
Well, I don't think so @dani-lbnl.
I am proposing that the GUI of the widget has a save option that gives you a string with all the options that define its current state (camera, roi, colors, units, long etc). Or just a viewer.get_state() member function.
And a load function to pass that string back to the viewer. Or a viewer.set_state(). This would allow to easily set the viewer initial state in following executions of the notebook.
@phcerdan these examples show how to provide camera and color options to the viewer:
- https://github.com/InsightSoftwareConsortium/itkwidgets/blob/master/examples/SpecifyAColormap.ipynb
- https://github.com/InsightSoftwareConsortium/itkwidgets/blob/master/examples/SpecifyCameraParameters.ipynb
Please let us know if there are options that you want to specify that cannot be set.
Hi there,
I'd just like to chime in with an issue I reported over at pyvista:
https://github.com/pyvista/pyvista/issues/714
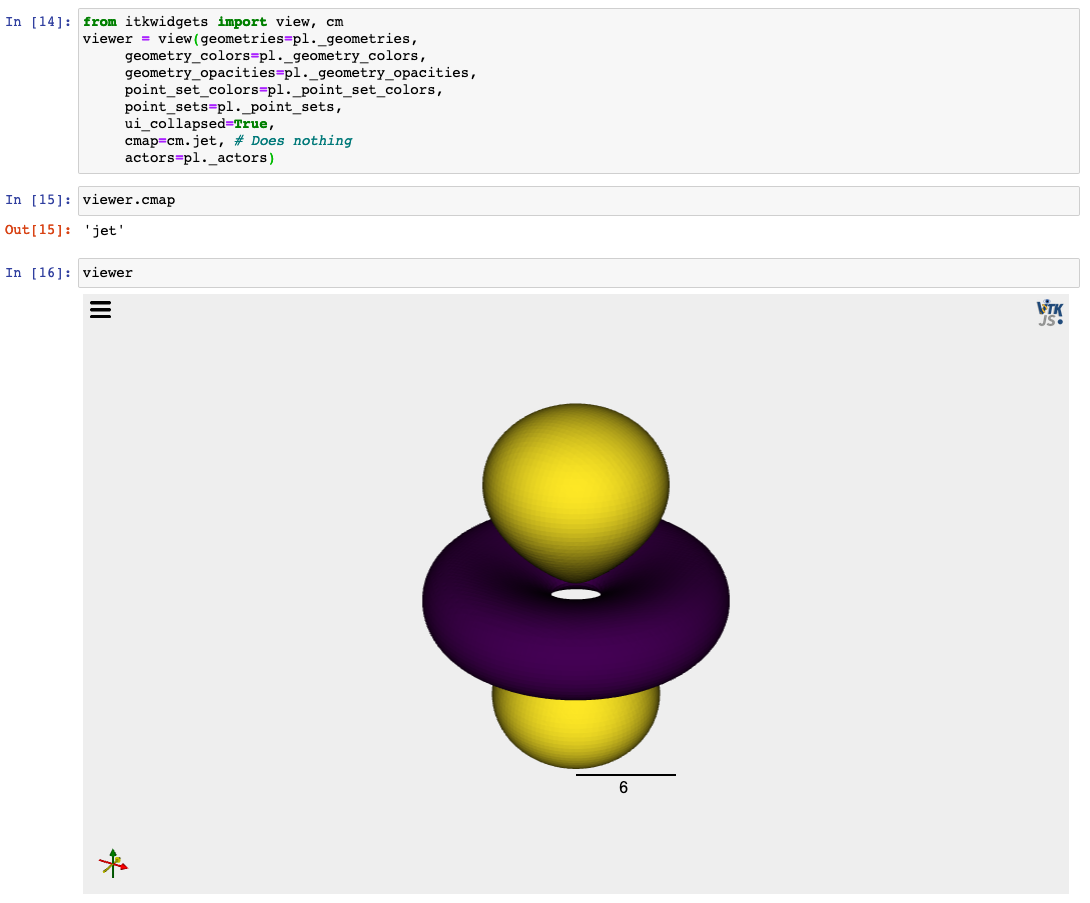
I created a notebook to visualize isosurfaces (https://mybinder.org/v2/gh/leeping/hydrogen-orbitals/master) but there seems to be no way to set the colormap that the viewer is created with. For example, the code below does not work for me:
pl = getOrbitalIsosurface(n, l, m, make_real=True) # pyvista.PlotterITK object
from itkwidgets import view, cm
view(geometries=pl._geometries,
     geometry_colors=pl._geometry_colors,
     geometry_opacities=pl._geometry_opacities,
     point_set_colors=pl._point_set_colors,
     point_sets=pl._point_sets,
     ui_collapsed=True,
     cmap=cm.jet, # **Does not affect the colormap**
     actors=pl._actors)
@leeping yes, we intend to add support for colormaps and lookup tables from pyvista. For point sets and geometries, the color will be based on the scalars-to-colors, i.e. colormap or lookup table, associated with the array name we are currently coloring by and whether we are coloring by point data or cell data, i.e. the VTK data model.
@banesullivan
Thank you, @thewtex . I also tried to use solid colors for this application because the isosurfaces do not require the full range of the colormap, but when I added two "meshes" with different colors the viewer does not appear.
    pl = pv.PlotterITK()
    grid = pv.StructuredGrid(x, y, z)
    # f_data is volumetric data
    grid["vol"] = f_data.flatten(order='F')
    # Create two isosurfaces for positive and negative isovalues
    isosurface_1 = grid.contour([isovalue])
    pl.add_mesh(isosurface_1, color="red")
    isosurface_2 = grid.contour([-isovalue])
    pl.add_mesh(isosurface_2, color="blue")
    pl.show(True) # Viewer does not appear.
Viewer does not appear.
@leeping please try upgrading to the soon-to-be-released itkwidgets-0.29.0.
@dani-lbnl @phcerdan we have the ability to initialize the opacity transfer function with #328 .
Thank you @thewtex - because I install my packages using conda, I might wait until it is released to test everything works locally and on Binder.
- Lee-Ping
Hello there,
I'm revisiting this issue as I'm teaching the same course material again. I'm now using version 0.32.0 of itkwidgets.
pl.show(True) # Viewer does not appear.
This issue has been resolved. Thank you!
I'd still like the ability to set the colormap that the viewer is created with, as I have some "nontrivial" colormaps where the isosurface is colored using a different function. Please let me know if this is possible.
Thanks a lot,
- Lee-Ping
Hi Lee-Ping,
Thanks for the great feedback.
The colormap for images can currently be specified with the cmap keyword argument to the viewer, and we are improving support for colormap specification on geometries like iso-surfaces.
Matt
I'd like to chime in and say I'd like to be able to save and restore the transfer function (and everything else in the viewer's state). It'd be nice to be able to create a visualization exactly the way I want and then share it with others.