icinga2
 icinga2 copied to clipboard
doubled memory consumption after update to 2.12.3 and mem fluctutations when reloading icinga
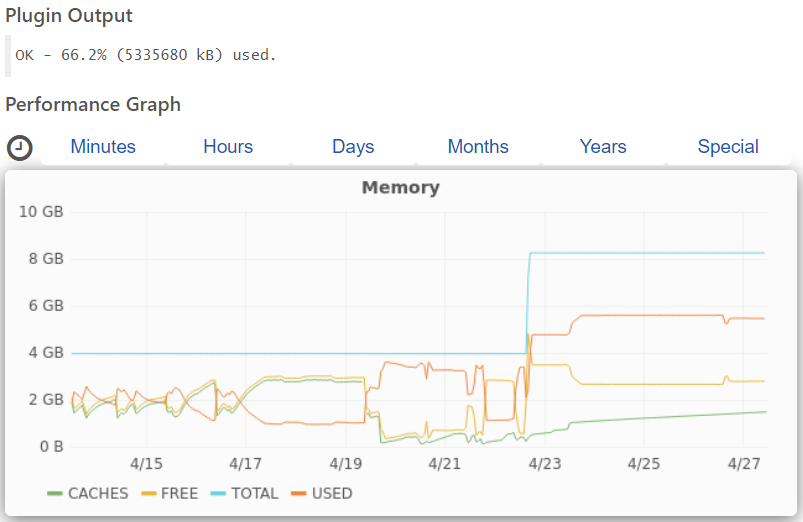
after updating icinga from 2.10.5 to version 2.12.3 the memory load which was typically between 1gb and 2gb for the icinga process now consumes between 1gb to 4gb.
sometimes restarting icinga helps to reduce but after an icinga reload the memory consumtion can raise back to almost 4gb. a reload happens with every director deploy.
sporadically when leting icinga running without reload for a few days the consumtion drops back to 1gb. i suspect the deploys there.
so in sum:
- the memconsumption doubled after the update
- there are inconsistancies between the memconsumtion after diverse reloads.
---edit---
after adding another 4GB RAM to the machine the memory consumtion went up to almost 6GB...
Does Icinga consume less memory if you install jemalloc and add LD_PRELOAD=/usr/lib64/libjemalloc.so.1 to /etc/sysconfig/icinga2?
seems that it helped. now the mem. consumption dropped from 6gb to 2gb. i will observe it for a few days. please do not close this bug yet.
could this one be related? https://bugzilla.redhat.com/show_bug.cgi?id=1943623 CVE-2021-3470
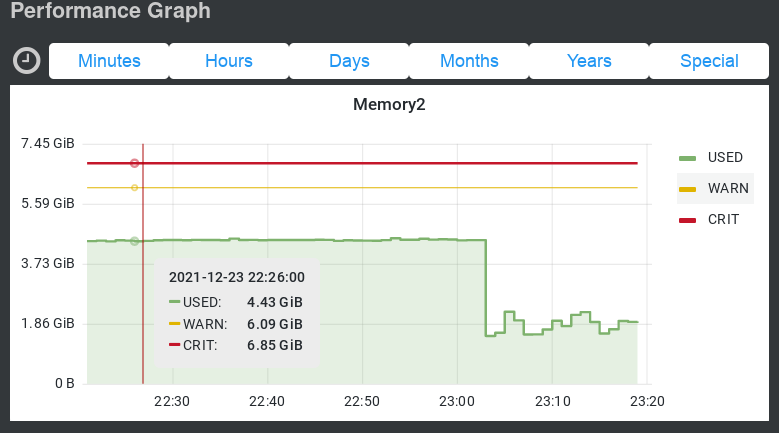
here the mem. consumption with jemalloc:

Isn’t that issue about a "heap allocator other than jemalloc or glibc's malloc"?
Isn’t that issue about a "heap allocator other than jemalloc or glibc's malloc"?
yes that is the one.
Hey. I have noticed the same increase in memory usage with 2.12 as reported by @e3k Switching to jemalloc2 seems to have fixed it without any adverse effects so far. Memory usage went down from 4.47 GB to 1.53 GB - 2.51 GB. Load seems also lower, though I do not have any hard evidence for that.
Some numbers (8vCPU, 8GB RAM, ESXi 7, Docker, Deb 11):
Config:
[2021-12-23 23:00:16 +0100] information/cli: Icinga application loader (version: r2.13.2-1)
[2021-12-23 23:00:16 +0100] information/cli: Loading configuration file(s).
[2021-12-23 23:00:17 +0100] information/ConfigItem: Committing config item(s).
[2021-12-23 23:00:17 +0100] information/ApiListener: My API identity:
[2021-12-23 23:00:20 +0100] information/ConfigItem: Instantiated 8744 Notifications.
[2021-12-23 23:00:20 +0100] information/ConfigItem: Instantiated 156 Dependencies.
[2021-12-23 23:00:20 +0100] information/ConfigItem: Instantiated 1 IcingaApplication.
[2021-12-23 23:00:20 +0100] information/ConfigItem: Instantiated 103 HostGroups.
[2021-12-23 23:00:20 +0100] information/ConfigItem: Instantiated 1536 Hosts.
[2021-12-23 23:00:20 +0100] information/ConfigItem: Instantiated 1 EventCommand.
[2021-12-23 23:00:20 +0100] information/ConfigItem: Instantiated 140 Downtimes.
[2021-12-23 23:00:20 +0100] information/ConfigItem: Instantiated 46 Comments.
[2021-12-23 23:00:20 +0100] information/ConfigItem: Instantiated 1 CheckerComponent.
[2021-12-23 23:00:20 +0100] information/ConfigItem: Instantiated 1 ApiListener.
[2021-12-23 23:00:20 +0100] information/ConfigItem: Instantiated 10 NotificationCommands.
[2021-12-23 23:00:20 +0100] information/ConfigItem: Instantiated 4 Zones.
[2021-12-23 23:00:20 +0100] information/ConfigItem: Instantiated 2 Endpoints.
[2021-12-23 23:00:20 +0100] information/ConfigItem: Instantiated 1 IdoPgsqlConnection.
[2021-12-23 23:00:20 +0100] information/ConfigItem: Instantiated 41 ApiUsers.
[2021-12-23 23:00:20 +0100] information/ConfigItem: Instantiated 1 InfluxdbWriter.
[2021-12-23 23:00:20 +0100] information/ConfigItem: Instantiated 257 CheckCommands.
[2021-12-23 23:00:20 +0100] information/ConfigItem: Instantiated 1 LivestatusListener.
[2021-12-23 23:00:20 +0100] information/ConfigItem: Instantiated 1 NotificationComponent.
[2021-12-23 23:00:20 +0100] information/ConfigItem: Instantiated 52 UserGroups.
[2021-12-23 23:00:20 +0100] information/ConfigItem: Instantiated 90 Users.
[2021-12-23 23:00:20 +0100] information/ConfigItem: Instantiated 5 TimePeriods.
[2021-12-23 23:00:20 +0100] information/ConfigItem: Instantiated 28 ServiceGroups.
[2021-12-23 23:00:20 +0100] information/ConfigItem: Instantiated 3 ScheduledDowntimes.
[2021-12-23 23:00:20 +0100] information/ConfigItem: Instantiated 9890 Services.
[2021-12-23 23:00:20 +0100] information/ScriptGlobal: Dumping variables to file '/var/cache/icinga2/icinga2.vars'
[2021-12-23 23:00:20 +0100] information/cli: Finished validating the configuration file(s).
Vanilla 2.13.2: $ time icinga2 daemon -C real 0m3.503s user 0m8.523s sys 0m1.394s
$ time icinga2 daemon -C real 0m3.088s user 0m7.537s sys 0m1.260s
jmealloc2: $ time icinga2 daemon -C real 0m2.895s user 0m7.205s sys 0m1.108s
$ time icinga2 daemon -C real 0m2.801s user 0m7.025s sys 0m0.973s
Some graph:
On a smaller instance (cca 500 hosts, 1.5k services) the effect was not really noticeable (around 1% difference), but without any adverse effects.
This is a substantial improvement and while it may not be applicable to every system out there I believe it would be nice to have this mentioned in the docs or have a toggle.
Merry Christmas and thank you for all the work :smiley:
I'm noticing the same memory leak issue. FreeBSD 12 and icinga r2.13.2-1.
Here's my graph:

I have distributed setup and the master node is the one where all the passive checks and API requests go. And it is the only one experiencing memory leaks. Or was - i switched to jemmalloc2 and so far things look quite stable. So far.
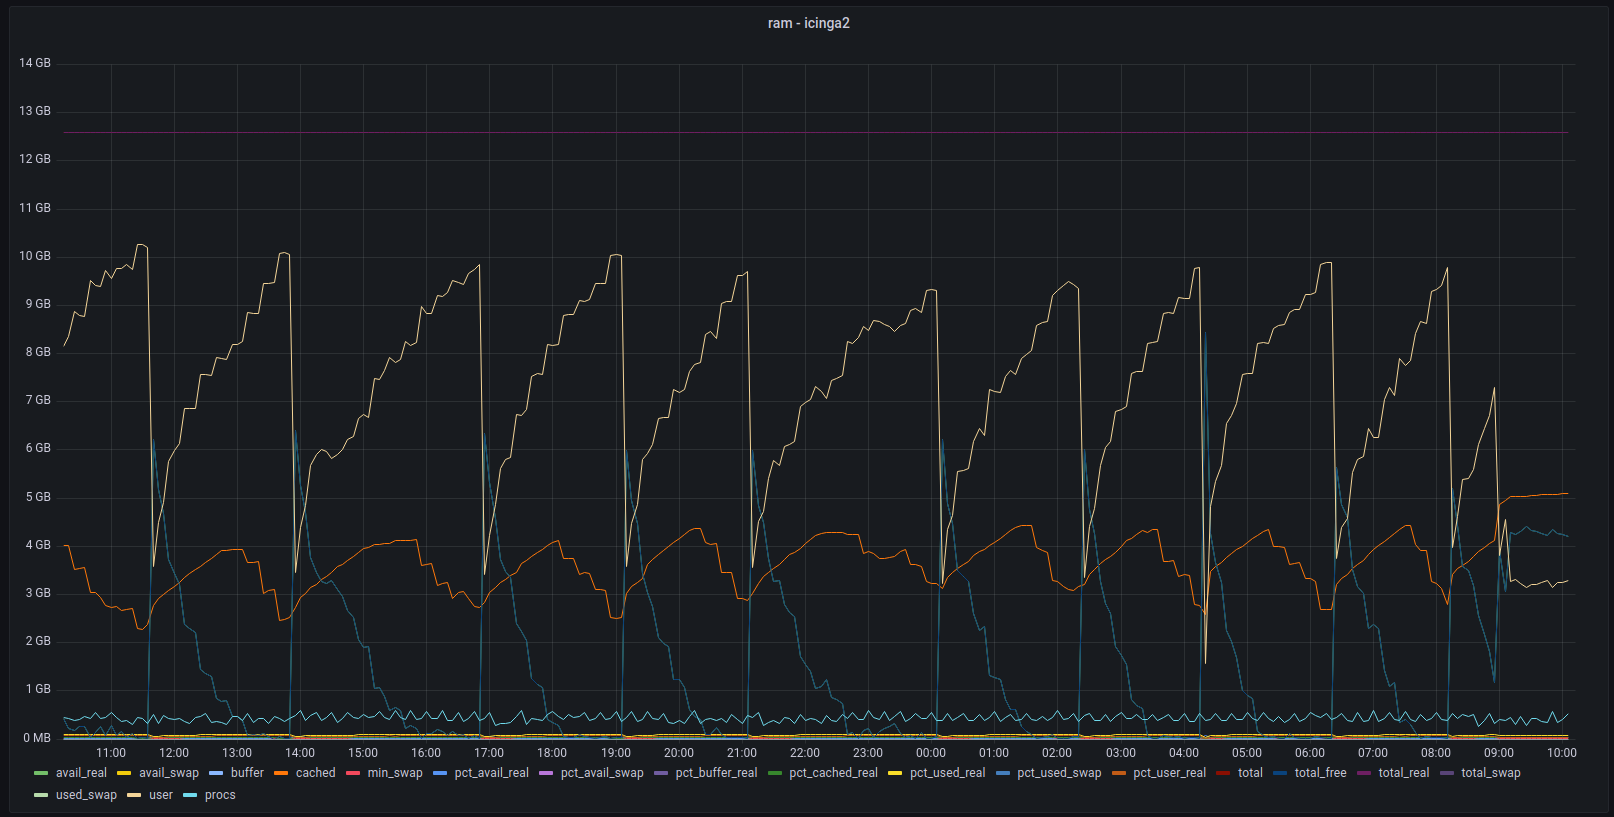
The switchover was at ~9:00 and the process behaviour looks quite stable.
My money is definitely on something related to icinga2 API.
after 24h of running with jemalloc2
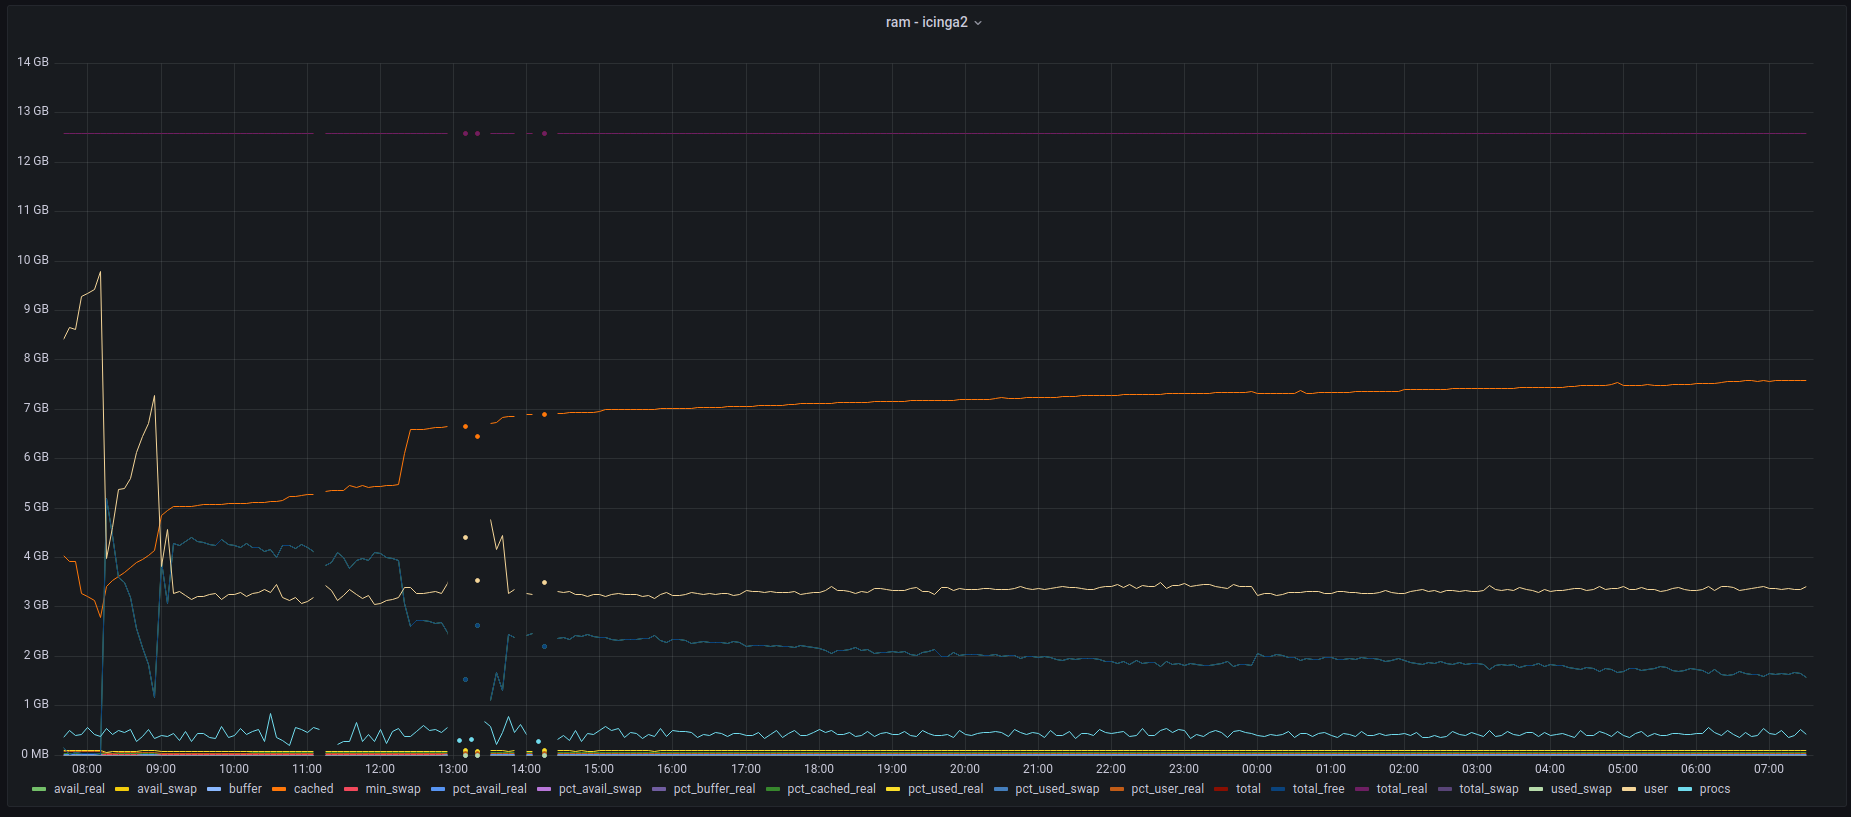
The fairly stable yellow line at ~3.2GB mark is the ram usage.
Does any of you either
- not have integrated jemalloc
- have integrated jemalloc, but it doesn't help
AND
frequently use Icinga 2 API filters like host.name==X && service.name==Y which target only one specific object?
I do not see any shared library with the name 'jemalloc' on my icinga2 binary.
Now when you say "like", well it's hard to know what you mean exactly. I have a few checks which only return one specific object but they don't have the AND conditional.
Do your filters look more like host.name=="X" or either of:
- /v1/objects/hosts/X
- ?hosts=X
{"hosts": ["x"]}
Does the memory consumption get better if you change such API calls according to #9188 (OP + 1st comment)?
I would like to help here but I no longer have a dev site to do this. I am unable to change the live site due to...well...it's live and people will scream if I do this kind of testing. ;)
I assure you, it can only get better. GET /v1/objects/hosts/X is more efficient than GET /v1/objects/hosts with filter host.name=="X", but does the same thing. Same with passive checks and ?host=X vs. DSL filter.
So first of all, I think I am lacking some context here. #9188 talks about API requests, but I quite likely have little context or understanding into how writing in icinga2's configuration language applies to an API request. I don't see those because I am not writing software which uses the API. I am seeing this (as an example):
object ServiceGroup "icinga2meta" {
   display_name = "Icinga2 Checks"
   assign where match("cluster*", service.check_command)
So when you start talking GET and REST API, well I don't use that directly. I suspect (since you are talking API) that you are a developer who sees this daily. Please understand I am not. :) I do not hack on icinga2 source code.
I can't even really try to fix my API or my configuration. FreeBSD's icinga2 builds have had a memory leak for at least a year, and random crashing issues for longer (#7539). I now have a cronjob that restarts icinga2 everytime the swap usage exceeds a certain amount. This issue is right now the lowest hanging fruit I have and since I have the system "live" and working (in a manner) and monitoring live critical servers, I dare not change it. I used to have a dev instance I could mess with, but given these issues are unresolved, I made the decision to abandon it.
I did ask what jemalloc was, but no one answered with anything substantive so I could maybe alter the FreeBSD port to pull in jemalloc (or jemalloc2) and see if that addressed the issue I am having.
My current impression is that the icinga2 team is not willing or able to support FreeBSD (like it needs to be) to address these issues. This is of course the decision of the people involved, and may be due to lack of resources. However, this should also explain to you why I haven't spent much time looking into any API issues or even configuration construction issues.
I probably do not understand icinga2's configuration language like I should. Having said that, if a particular domain specific application language allows you to configure a memory leak or crashing server, I would normally consider that a bug and not a feature. ;)
@davehayes the api issue might be in the cluster, when two nodes talk to each other. or when using thruk as reporting gui
jemalloc is a different memory alocator library, and i just LD_PRELOAD it for icinga2, so it overrides typical libc functions like memset and friends with its own implementation. This greatly stabilized my icinga2 installs and reduced memory load as well.
I'm on FreeBSD of course. How do I get jemalloc? Is there a port?
i though jemalloc was from bsd, tbh.
Modern jemalloc releases continue to be integrated back into FreeBSD, and therefore versatility remains critical.
https://github.com/jemalloc/jemalloc