Bug in chart of a float value. Duplicated curve
Expected Behavior
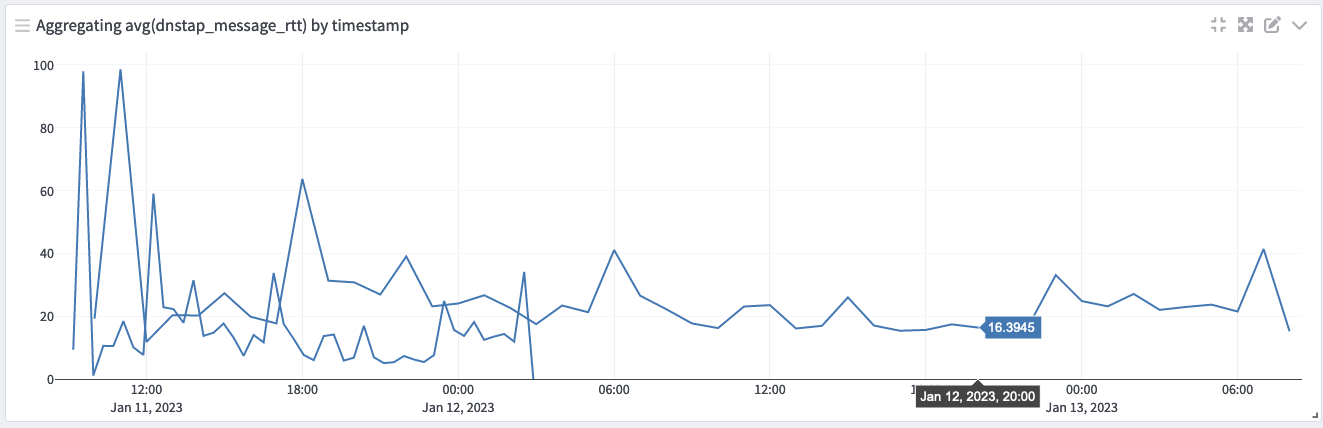
When just one metric is plotted only one curve should appear.
Current Behavior
Turns out two curves appear, slightly shifted vertically. Moreover, it seems to be related to refresh when redrawing them. If I resize the widget one of the curves remains stuck at the old width.
Screenshots are self explanatory.

Possible Solution
No idea, but seems to be related to chart refresh.
Steps to Reproduce (for bugs)
I selected a float value to draw an average chart for a 2 day time period.
Two curves appeared. When resizing it, the behaviour observed in the second screenshot happened. The "extra" curve kept the width it had before resizing.
Context
Your Environment
- Graylog Version: 5.0.2
- Java Version: OpenJDK 17.0.5+8.1_1
- Elasticsearch Version: OpenSearch 2.4.1
- MongoDB Version: 5.0.14
- Operating System: FreeBSD 13.1
- Browser version: Firefox 108.0.2 and Safari Version 16.2 (18614.3.7.1.5)
Hey @borjam,
thanks for reporting this! Did this happen once or can you reproduce it? If you can, could you provide steps for us how to reproduce it? Does it happen only for float fields?
I have reproduced it a couple of times, even restarting Graylog. However I have tried again and it´s not happening now. :/
I will let you know if it happens again. But before reporting I saw it three or four times.
Hello,
I have been unable to reproduce this for a long time now. Impossible for me to identify a culprit. Either Graylog or Firefox / Safari.
Right now I am running Graylog 6.1.8 but I am not able to recall when it stopped happening. It was a bit random and since I opened this issue I updated Graylog, the operating system and Firefox several times.
Thank you @borjam! We will close this issue for now. If it happens again, please reopen the issue. Thank you very much for your support!