opentelemetry-operations-python
 opentelemetry-operations-python copied to clipboard
Spans issued in Google Cloud Functions are not tied to a single Trace ID
Spans that are automatically issued when my application running on Cloud Functions receives HTTP requests and other spans that are created by explicitly entering span in my code are tied to different trace IDs, resulting in poor browsability. Below is my code. I would appreciate help if anyone knows why they are tied to different Trace IDs or if anyone else has encountered the same phenomenon. By the way, when I traced almost the same code to an application running in Cloud Run, all spans were tied to one Trace ID.
My code is below
This is main.py and handler method is deployed to Cloud Functions as entry point
### main.py
from tracing import init_trace, add_trace_span

init_trace(environment="production")

@add_trace_span
def handler(req: Request) -> Response:
    # do something
This is tracing.py
### tracing.py ###

from functools import lru_cache, wraps

from opentelemetry import trace
from opentelemetry.trace import Tracer
from opentelemetry.sdk.trace import TracerProvider
from opentelemetry.exporter.cloud_trace import CloudTraceSpanExporter
from opentelemetry.sdk.trace.export import SimpleSpanProcessor
from opentelemetry.sdk.trace.sampling import TraceIdRatioBased
from opentelemetry.sdk.resources import Resource
from opentelemetry.propagate import set_global_textmap
from opentelemetry.propagators.cloud_trace_propagator import (
    CloudTraceFormatPropagator,
)

def init_trace(environment: str):
    set_global_textmap(CloudTraceFormatPropagator())
    tracer_provider = TracerProvider(
        sampler=TraceIdRatioBased(1),
        resource=Resource.create(
            {
                "service.name": "sample-application",
                "service.environment": environment,
            }
        ),
    )
    exporter = CloudTraceSpanExporter(resource_regex="service.*")
    tracer_provider.add_span_processor(SimpleSpanProcessor(exporter))
    trace.set_tracer_provider(tracer_provider)

def add_trace_span(f):
    @wraps(f)
    def wrapper(*args, **kwargs):
        tracer = get_tracer()
        with tracer.start_as_current_span(name=f.__qualname__):
            return f(*args, **kwargs)

    return wrapper
Could you share some details:
- a screenshot of the spans your seeing in different traces
- what versions of Cloud Run and Cloud Functions are you using?
By the way, when I traced almost the same code to an application running in Cloud Run, all spans were tied to one Trace ID.
When you run it in Cloud Run, what sort of instrumentation and framework are you using for Cloud Run? set_global_textmap(CloudTraceFormatPropagator()) sets the propagator for OTel, but something still needs to run it in. Usually this is an HTTP framework instrumentation.
@aabmass Thank you for the response.
a screenshot of the spans your seeing in different traces
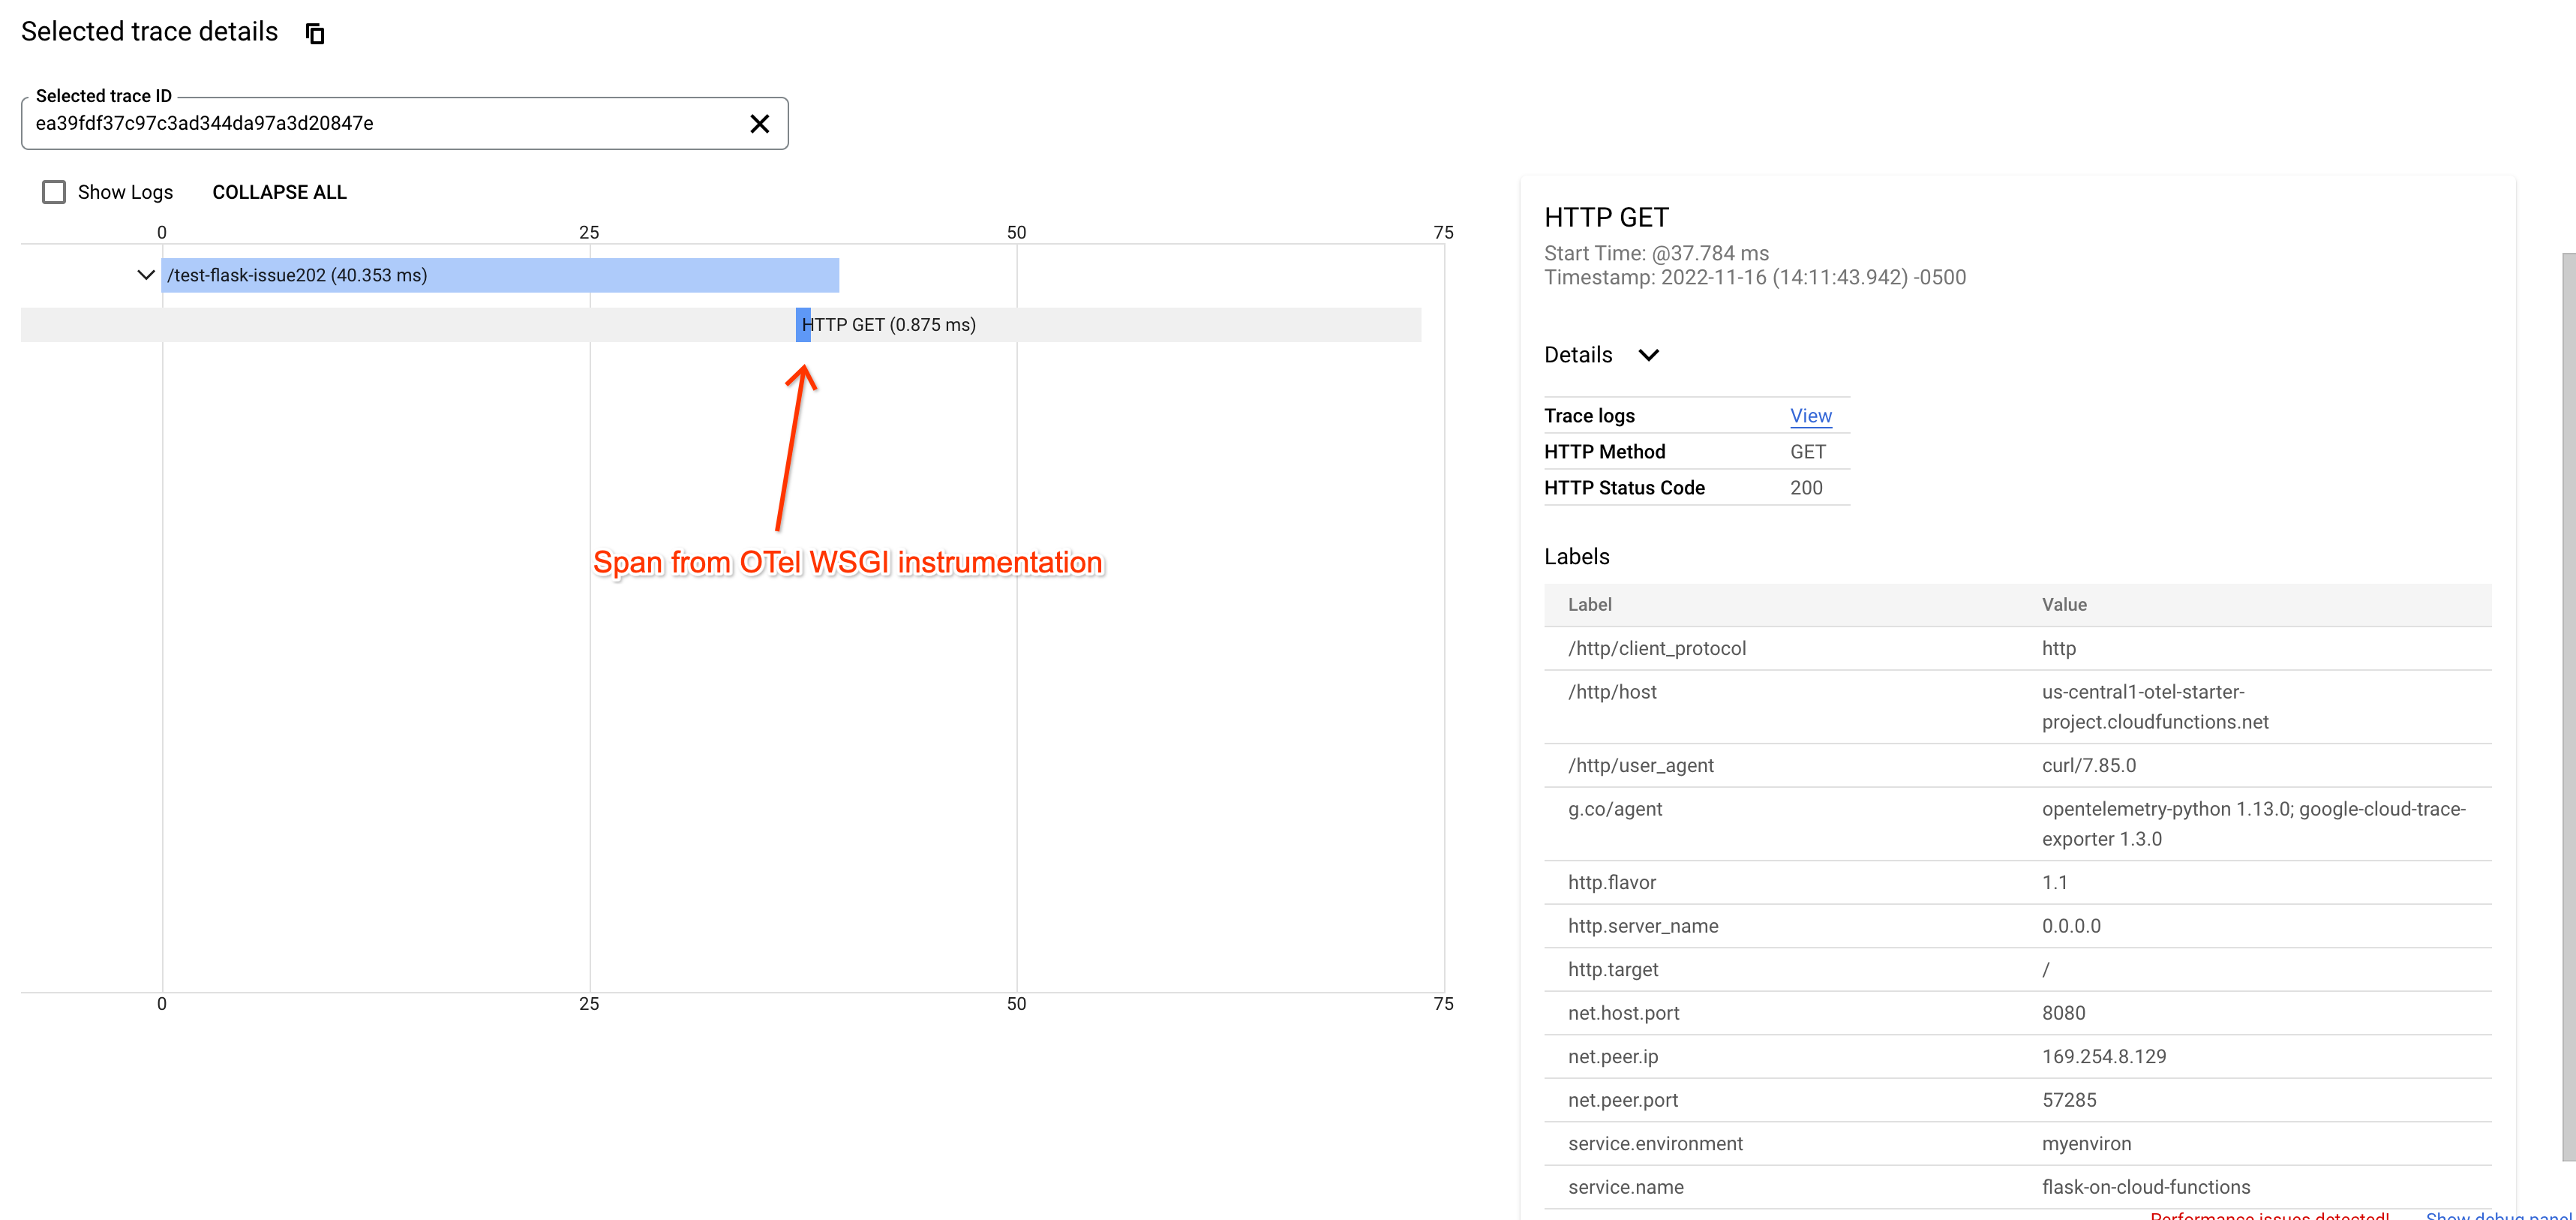
This screenshot indicates that three spans were issued in one request. The spans are the one issued by the http request(span A), the one issued by issuing the span in the code(span B), and the one issued by the request to favicon.io(span C).
Below are trace details for each span
span A

span B

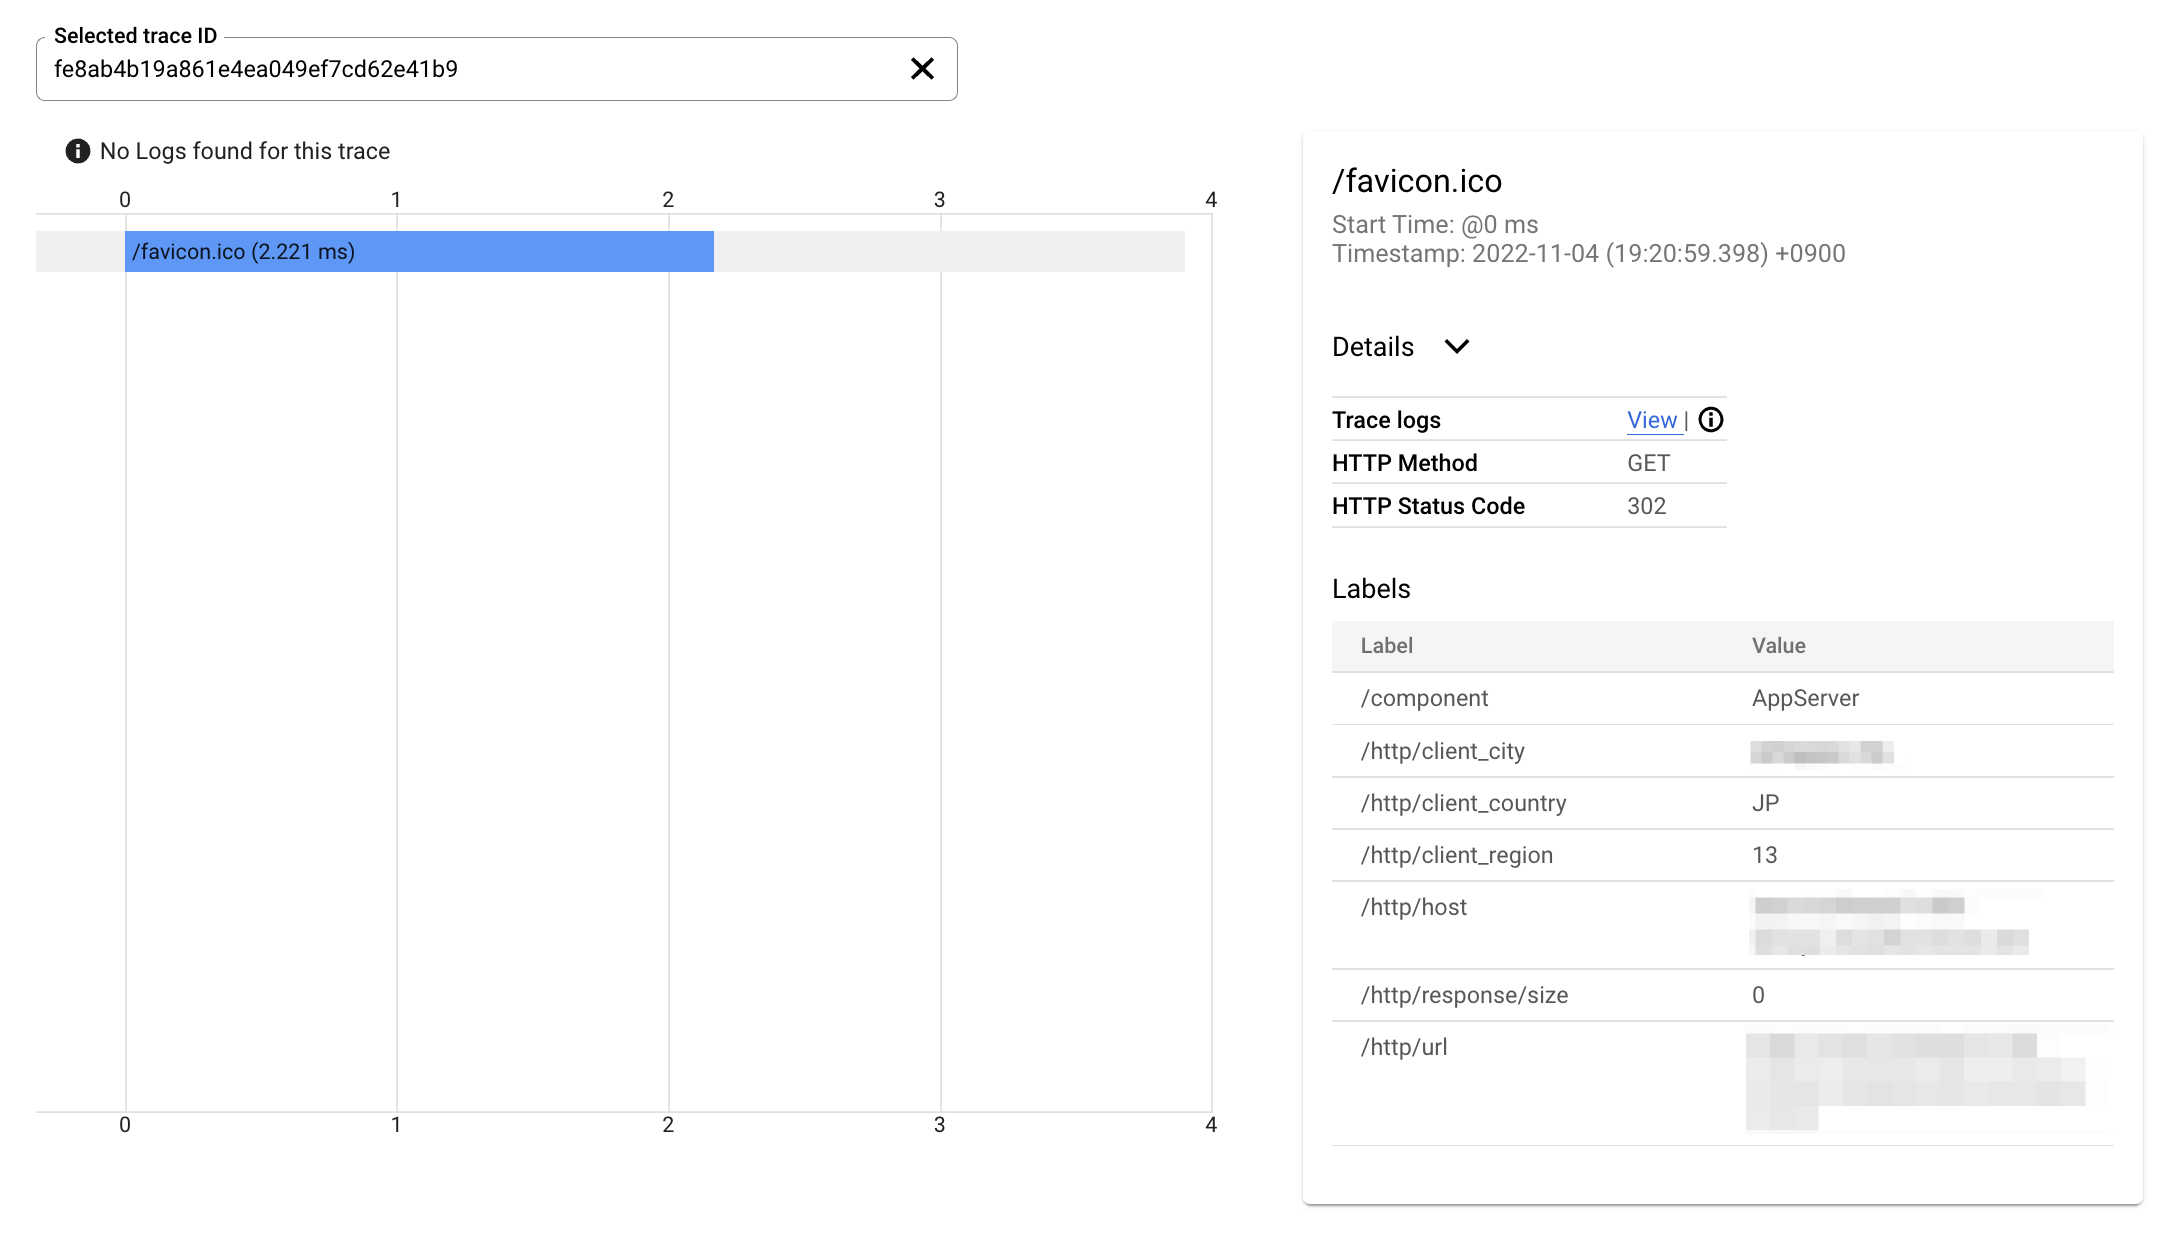
span C
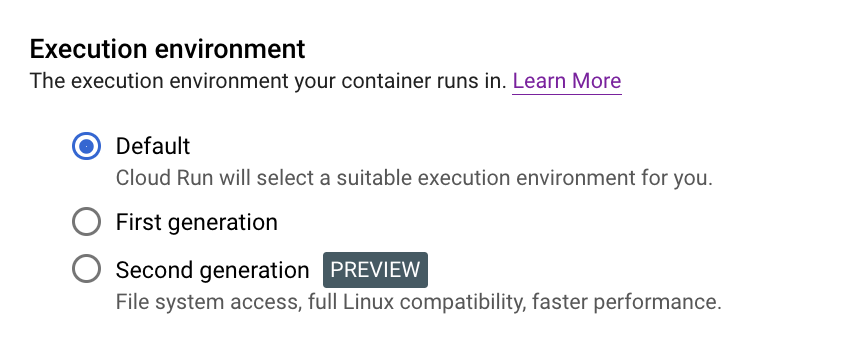
what versions of Cloud Run and Cloud Functions are you using?
I use Cloud Functions 1st gen. I don't know Cloud Run has version system but guess you mean Execution environment? If so, it's Default.
something still needs to run it in. Usually this is an HTTP framework instrumentation.
I use FastAPIInstrumentor for an application running on Cloud Run and use FlaskInstrumentor for an application running on Cloud Functions This is a project to manage a sample Python application (using FastAPI or Flask) and the code details can be found here https://github.com/mfkessai/opentelemetry-python-sample-app
Thanks for the info! Follow up question, what do you mean by this:
other spans that are created by explicitly entering span in my code are tied to different trace IDs
Based on the screenshots and looking at the code you linked, it seems like you are sending 3 separate requests which I would expect to end up in 3 separate traces. If you want them to end up in the same trace, you need to issue the 3 requests passing the same parent span ID in x-cloud-trace-context header: https://cloud.google.com/trace/docs/setup#force-trace
@aabmass
it seems like you are sending 3 separate requests which I would expect to end up in 3 separate traces
It's wrong. I request only once and opentelemetry issues 3 spans. In this case two spans should be issued, first span is a merger of Span A and Span B. And second is just Span C. Since this is favicon fetch request, it is not a problem for Trace to separate them.
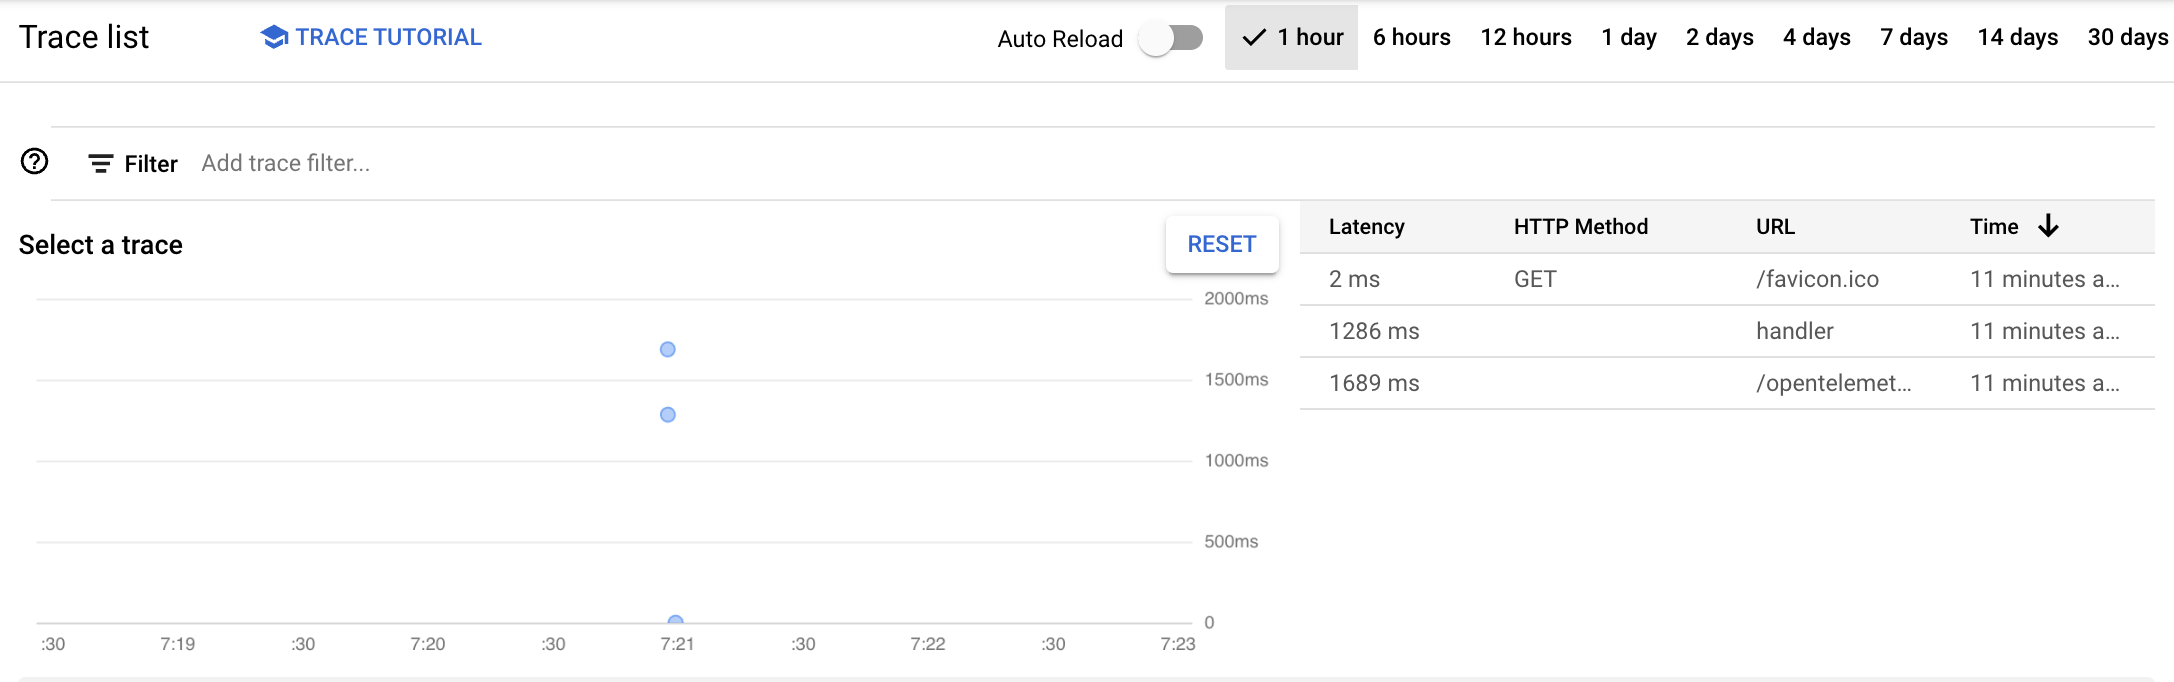
When I request to a Python application running on Cloud Run(sample code is here), only one span is issued always. So I think it's bug or something is missing a necessary setting for Flask application on Cloud Functions with OpenTelemetry.
This is a screenshot the span was issued by requesting to Python application running on Cloud Run

I'm having a hard time following your screenshots, I think you mean Trace A/Trace B? Anyway, I took a look at your repo. The README.md for cloud functions says to deploy with
gcloud functions deploy opentelemetry-flask-sample \
          --entry-point handler \
          --runtime python310 \
          --trigger-http \
          --project {YOUR_PROJECT} \
          --region asia-northeast1 \
          --allow-unauthenticated
Your handler entrypoint is not using the wrapped flask app: https://github.com/mfkessai/opentelemetry-python-sample-app/blob/main/flask-on-cloud-functions/main.py#L15-L16. I'm not super familiar with Cloud Functions but it sounds like you should be using functions framework (or maybe it's implicitly included for you?).
Looking at the functions framework code, the app seems to be available for import from functions_framework module https://github.com/GoogleCloudPlatform/functions-framework-python/blob/5daeb4aaf130f2714fe1a0f799b09cb01703d9bd/src/functions_framework/init.py#L321 and you may be able to wrap that with the instrumentor.
If that also doesn't work, you can try the full on monkeypatching approach from here:
## instruments just this app
# FlaskInstrumentor().instrument_app(app)

## instruments flask globally
FlaskInstrumentor().instrument()
@kamillle I tried out the options I listed with no luck. However the below did work and I can see propagation working correctly
import flask
from opentelemetry.instrumentation.wsgi import OpenTelemetryMiddleware

flask.current_app.wsgi_app = OpenTelemetryMiddleware(flask.current_app.wsgi_app)
full example in this branch.