Lighthouse "Script Parse" metric is off
Parse metrics show up in Lighthouse through the "Reduce JavaScript execution time" diagnostic in the Performance audit. The code is in bootup-time.js (https://github.com/GoogleChrome/lighthouse/blob/b8ee28f2f4c6eb5bf02065e731e612f8f46b4e7f/lighthouse-core/audits/bootup-time.js#L134-L139) and looks for the scriptParseCompile task group, which Lighthouse defines based on the following trace events:
scriptParseCompile: {
  id: 'scriptParseCompile',
  label: 'Script Parsing & Compilation',
  traceEventNames: ['v8.compile', 'v8.compileModule', 'v8.parseOnBackground'],
},
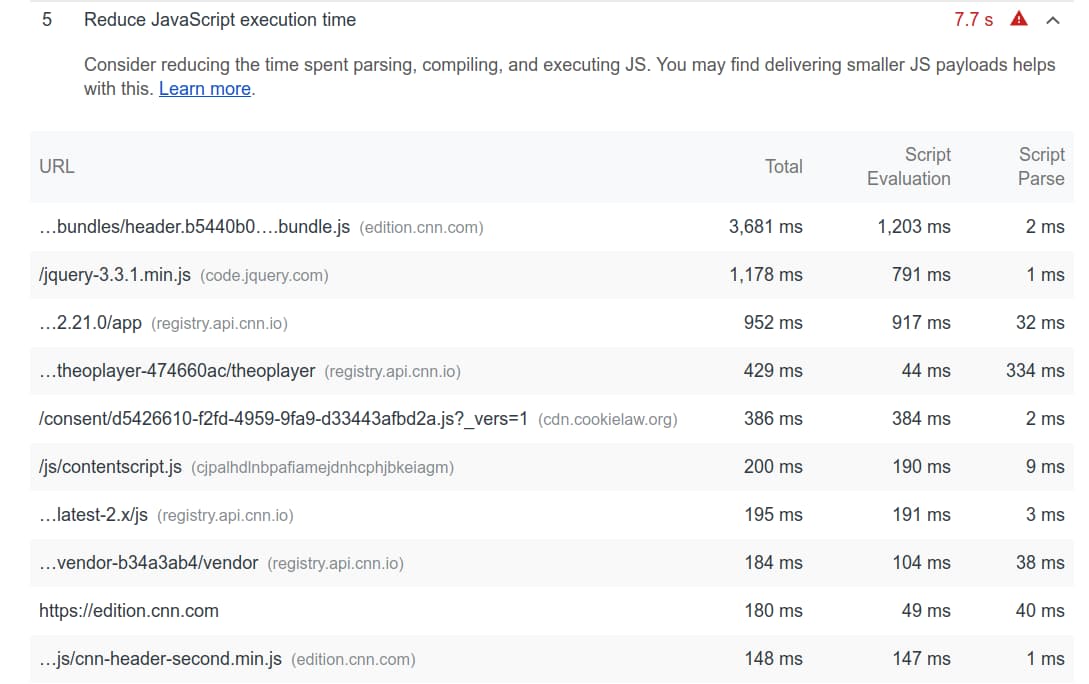
An example report looks as follows:
"Script Parse" intends to cover "Script Parse + Compile" and should probably be renamed as such, but even then the metrics are misattributed. Lighthouse is currently underreporting "[main thread] script parse + compile" and overreporting "script evaluation" by roughly the same amount, due to “lazy” compilations (i.e. on-demand compilation of non-IIFEs) and eval compilations falling into the “evaluation” rather than “parse & compile” bucket. The exposed metric includes the v8.parseOnBackground trace event, although time spent on background threads explicitly does not contribute to main thread blocking time and is therefore not useful to report --- in fact, reporting it can be harmful. The current Lighthouse-reported metrics might steer developers away from code splitting & serving multiple smaller scripts (which is great for parallelization, since we then spawn multiple small tasks) as opposed to a single massive script file.
Suggested changes in Lighthouse:
- rename "Script Parse" to "Script Parse + Compile" if that's indeed what we intend to show
- only count main thread time spent parsing + compiling, since that's what matters
cc @addyosmani @verwaest @LeszekSwirski
Thanks so much @mathiasbynens for the insights here!
only count main thread time spent parsing + compiling, since that's what matters
First, to hopefully calm the immediate alarm bells on v8.parseOnBackground :) we only ever count time spent on main thread even though that event name is in that group. It's purely for our categorization if we were to suddenly start summarizing other threads and should not be impacting the numbers in that audit.
rename "Script Parse" to "Script Parse + Compile" if that's indeed what we intend to show
This is fine by me! 👍 It is indeed capturing Script Parse + Compile. We just determined at the time that the set of Lighthouse users who know enough to distinguish between the two would most likely be examining the full trace and we can keep the title short but it's only 10 characters so we're not really saving that much 😄
Lighthouse is currently overreporting "script parse + compile" and underreporting "script evaluation" by roughly the same amount, due to “lazy” compilations
Interesting, wouldn't this be underreporting "script parse + compile" and overreporting "script evaluation" though then? Or are evaluations in which lazy compilations occur all underneath a v8.compile task? Do you have suggestions to identify and correctly categorize such cases?
The current Lighthouse-reported metrics might steer developers away from code splitting & serving multiple smaller scripts
Is this only because of the v8.parseOnBackground issue that I've addressed already? Or are there other miscategorizations that you think will incentivize this behavior?
Hey @patrickhulce, thanks for the detailed response.
we only ever count time spent on main thread even though that event name is in that group.
Oh, okay, that confused me. I admit I'm not familiar with Lighthouse internals. Can we remove parseOnBackground if it's not currently used anyhow?
Interesting, wouldn't this be underreporting "script parse + compile" and overreporting "script evaluation" though then?
Whoops, you're right! I'll correct my post to avoid confusion.
Or are evaluations in which lazy compilations occur all underneath a
v8.compiletask? Do you have suggestions to identify and correctly categorize such cases?
This is a good question. Maybe @LeszekSwirski can answer it more directly.
From the V8 side we tend to rely on our own RuntimeCallStats as opposed to the events exposed by DevTools, and we're more familiar with those. We recently found some bugs in the way DevTools surfaces these metrics, which adds to the confusion:
- What DevTools reports as "parse time" is actually parse + compile time.
- What DevTools reports as "compile time" is actually just copying the compiled result on the heap.
- With streaming parsing, what DevTools report as "parse time" is off by a variable factor (easily up to ~10x) since it includes the time the worker thread is doing nothing except waiting for data. (https://crbug.com/939275)
Would it be feasible for Lighthouse to hook into RCS directly for parse+compile metrics? This seems like the appropriate source of truth.
From the docs, it looks like you have to use a feature flag when Chrome is launched in order to get the stats in the trace event, is that accurate? (EDIT: just realized that was for blink's RCS and that V8 is totally different 😄, maybe it is just a trace event https://v8.dev/docs/trace#enabling-runtime-call-statistics-in-tracing )
~~If so, I don't think we'd be able to rely on it for such a core audit.~~ If we just need to request the trace category, then it's simply a question of the performance impact, which if it's not substantially different from the tracing we're doing already I think it'd be great improvement!