lighthouse
 lighthouse copied to clipboard
☔ Pagespeed Insights results differ from lighthouse in chrome
Hey there!
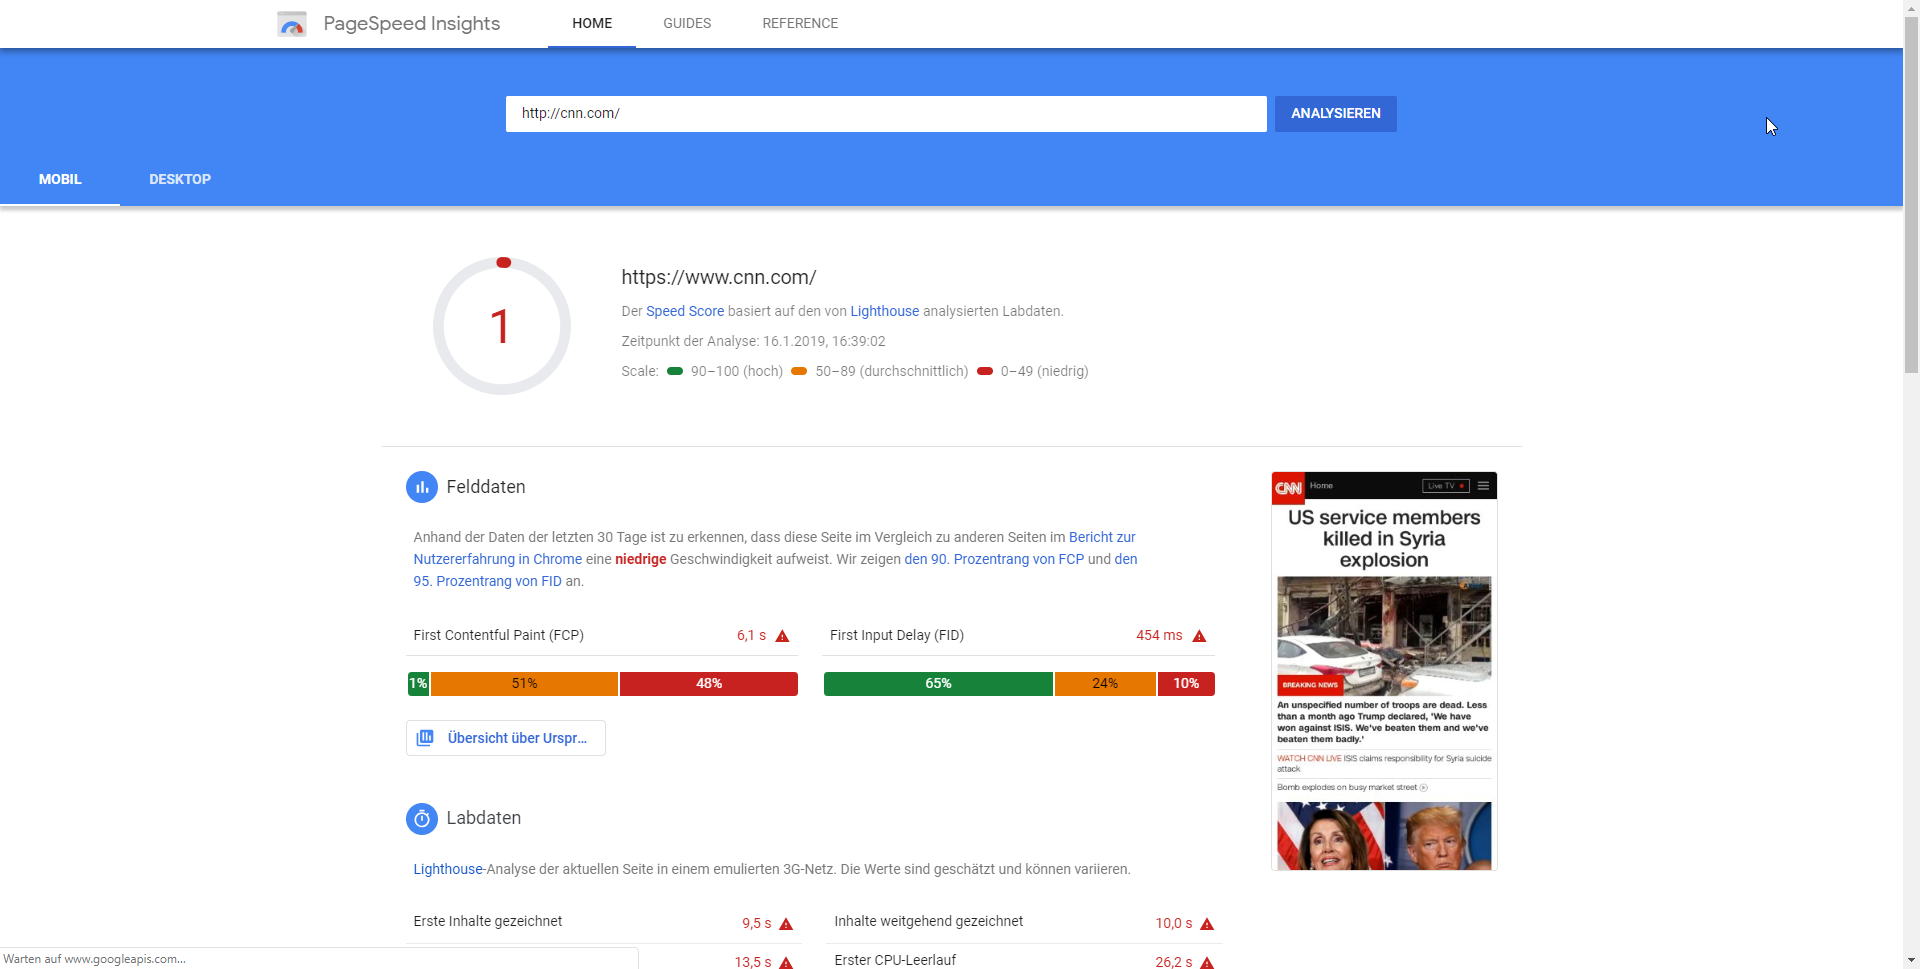
I'm optimizing a mobile site and lighthouse reported me a score of 92. So far so good i thought. But after checking back with Pagespeed Insights, which also uses lighthouse, i'm getting a score of 57.
Is there any reliable way to get the same score?
Hey, thanks for reaching out!
To help with diagnosing this we'll need to have the URL you're testing, and the context that you are running Lighthouse in.
How did you get the 92? Are you running on Devtools in Chrome? On the node CLI? And what throttling settings are you using?
Hey @exterkamp,
i've made an audit with lighthouse in DevTools in Chrome and now tested it with node CLI aswell. Lighthouse in DevTools gives a score of 92 (Performance) right now. Lighthouse (latest, 4.0.0-alpha.2-3.2.1) reports 75 for Best Practices and 0 for Performance. But still huge difference to the PSI score. Mailed you the corresponding website!
These are my settings:

Last test with lighthouse in DevTools:

Last test with PSI:


Last test with CLI

So I ran that URL against all channels and I am finding things to be a consistently in the high 50's low 60's for performance. I would say within expected variance.
Node v4.0.0-alpha.1
 PSI (I also force ran against an EU data center, and got similar results)
 DevTools in Production Chrome v3.0.3

The 0 for performance in the CLI, that definitely seems like an error, that site shouldn't get a 0, and if it consistently does without surfacing an error that might be a bug or something might be blocking LH from running locally?
If you run from other machines does your devtools still get such a high score? That seems unreasonably high given those settings, I am seeing a consistent ~10 seconds for TTI, but that screenshot of devtools running is ~4 seconds, seems oddly fast compared to the other runs.
@exterkamp Thanks for testing it. It's odd that there's no Performance score when using the CLI version (although Best Practices gets a score as you can see). And it's very odd that the TTI differs so much.
@exterkamp So, i made some changes to pass some more of the audits for mobile.
Lighthouse in DevTools Passed audits: 15 Performance Score: 83
Pagespeed Insights Passed Audits: 12 Performance Score: 45 (sometimes 55)
Both tests were made on newly updated production site.
Currently on Chromium Version 71.0.3578.80 I get the same weird results for almost any website. Lighthouse in DevTools is always 25-45 points better than on PSI.
example: https://www.omgubuntu.co.uk/ (got 82 in lighthouse and around 50 on PSI)


Could this be related to DNS lookups or similar stuff? Could PSI server have a little bit slower access to the tested website than my local machine (depending on where the server actually located in US or in EU?
@AlexVadkovskiy just checked the website (https://www.omgubuntu.co.uk/) from Germany.
PSI: 29 Lighthouse in DevTools: 90
(mobile scores)
Hmmm checking out https://www.omgubuntu.co.uk/ I get: ~80 from cli on v4.0.0-alpha.1 ~40 from pagespeed insights (running v4.0.0-alpha.1)
So this is solidly reproducible for that site.
I am force running pagespeed in the EU and seeing similar results. I will say that pagespeed has a consistent ~200ms TTFB while running locally have ~60ms TTFB, and that URL seems to send more images to pagespeed for some reason? Some odd behavior for sure, and some questionable latency which might be us or the site.
@patrickhulce might want to take a look at this from a lantern perspective on why this could be different/maybe something is up with the trace.
@paulirish might want to take a look at this from a global pagespeed latency perspective.
@exterkamp is this the same case as @wardpeet brought up? some of his runs in LR had every request duplicated which would immediately explain 2x lantern predictions.
@AlexVadkovskiy the Chromium difference is also probably explained by #6772 FYI
@patrickhulce I remember that, but I can't find that issue/discussion, you have a link to it/can you bump it to mention this thread?
but I can't find that issue/discussion, you have a link to it/can you bump it to mention this thread?
IIRC that's because we just discussed it over chat :) @wardpeet do you happen to still have those?
@patrickhulce so there is a bug in chrome which is mentioned in other issues. Will this fix the PSI score as well ?
Oops this got buried! Missed that bump. I will definitely be looking into these URLs again soon. So far we have:
- https://www.omgubuntu.co.uk/
- @wardpeet other url?
Taking a guess, the bug might be ignoring flags? But that shouldn't be an issue because this was reported before that version of Chrome shipped iirc.
I'm having the complete opposite experience with this. My dev tools Lighthouse is give me a score of 37 where PSI is giving a score of 91.
The url in question is: https://biketours.com

@ashtonlance Ah you're probably experiencing #6772 then. Give it a whirl in Chrome Canary.
Lighthouse is busted for me in Canary Version 73.0.3672.0.

I was able to get the Lighthouse CLI to produce similar results as PSI by turning off emulation and throttling.
@exterkamp I'm seeing the same issue, where Lighthouse reports a high score while PSI shows a lower one. You can try on this url
https://www.bankbazaar.com/credit-card.html?mobileSite=true
 Well, not that bad...
@ashtonlance something is off, that's Lighthouse 3.0.0-beta.0 which is ~8 months old, not the right Canary version 🤔
@patrickhulce Weird indeed. That was from a build I downloaded at https://www.google.com/chrome/canary/. However, I just downloaded a fresh copy and all seems to be good now.
Canary had a bug where we served old LH in Devtools. Lasted a coupled weeks. It's fixed now.
As of now, I'm scoring 91 on devtools, between 9 and 14 on PSI :/
url : https://www.southswelldesign.net/
Note that the default view for PSI is mobile, with quite stricter standards.
Facing the same problem here. We have websites in production for years with over 85-90 score on insights and lighthouse. After this latest update, the scores in lighthouse are still good (albeit lower in the range of 70-80) but the pagespeed insights is in the 40s!! Is this maybe an issue on Page Insights? Given the huge discrepancy it's hard for devs to fix this!
PSI did just suffer a bug that lowered scores unexpectedly @duartegarin & @j-bacal, so it seems like your sites may have stabilized back to more reasonable numbers.
@vertic4l, no major updates yet. I have been looking into more generalized variance within PSI itself, but will also look into PSI x Lighthouse side by side comparisons. Thank you all for giving us more sites where this is present. It definitely helps to try to track down the cause!