How to adjust CPU throttling in Chrome Lighthouse? M1 Mac
I'm using an M1 Macbook air, when I am trying to profile Javascript to emulate a slower device the JS still runs really fast and has very little blocking time, I believe this might be because the amount of throttling applied in devtools is too low for my CPU to Emulate the Moto G4 with Lighthouse 9.6.1.
Is my understanding correct and is there any easy way to increase the amount of throttling within Chrome so that I can emulate the Moto G4 more accurately?
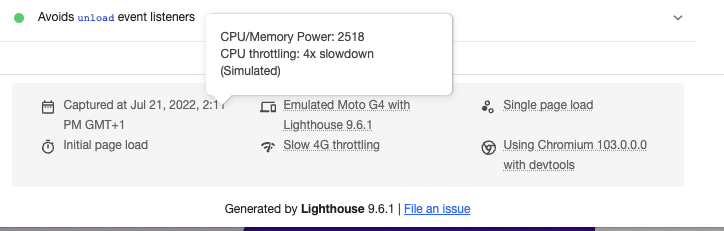
CPU/Memory power is still showing as 2500+ with a 4x slow down:
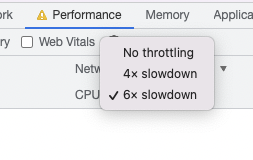
I've seen the following suggestion which says to open a dev tools window for the dev tools window and execute the JS, which works without error however doesn't change the amount of throttling or the cpu/memory power:
https://stackoverflow.com/questions/48751988/is-it-possible-to-set-custom-cpu-throttling-in-chrome-devtools
I've tested using the command line lighthouse and I'm able to emulate a much slower connection which then shows longer blocking time, so it does seem to be related to this.
Not sure this is actually related to lighthouse or not either, but ideally I would be able to add extra slowdown to the performance tab in Chrome too - so I can actually run a profiler over the code and work out where the slowdowns are coming from:
You're confusing our simulated slowdown with a real applied throttling.
The dropdown option in your second comment is real, applied throttling. However in the Lighthouse panel we ignore that specific setting and defer to this:
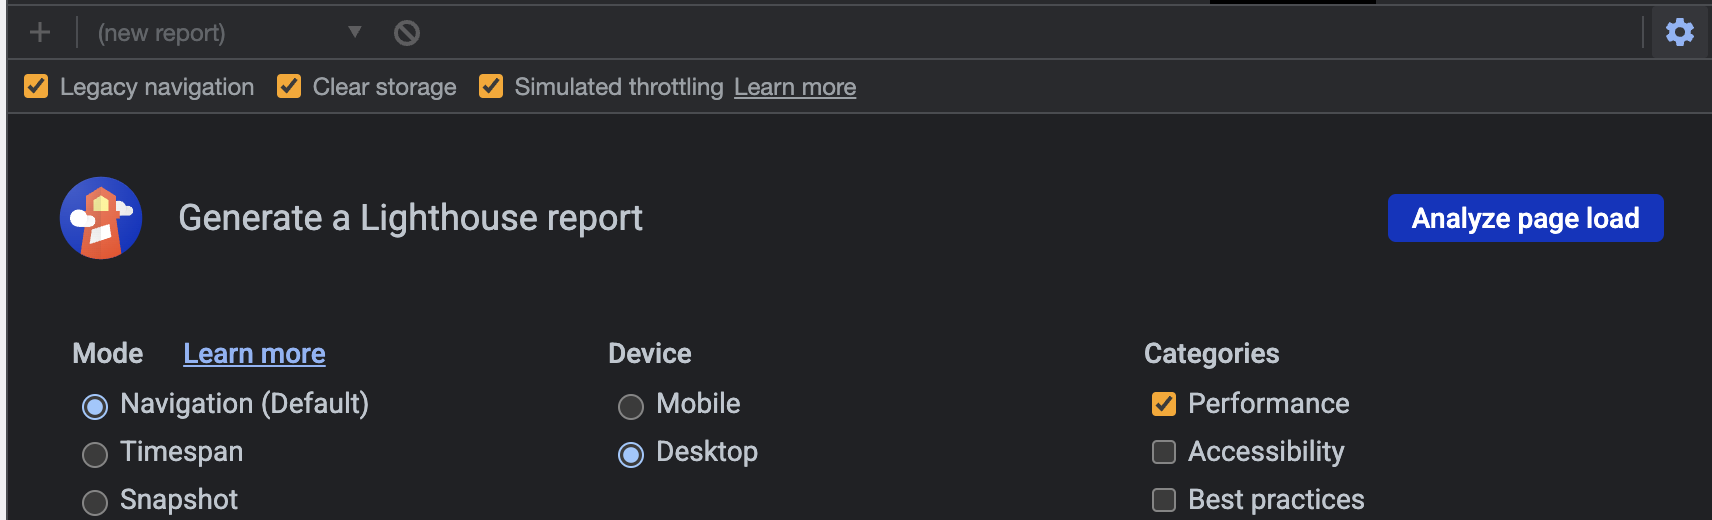
If simulated throttling is checked, we do load the page normally and do the "slowdown" in a simulation. If not checked, we do a real slow down at the browser-level. https://github.com/GoogleChrome/lighthouse/blob/master/docs/throttling.md#devtools-lighthouse-panel-throttling
Thank you for that information @connorjclark, I wasn't aware of the simulated slowdowns and real applied throttling.
In my case though, neither seem to be enough to slow down execution to get results similar to the online google page speed test - or my colleagues slower laptop - which means I cannot really debug any performance issues.
related: https://github.com/GoogleChrome/lighthouse/blob/master/docs/variability.md
You don't really need perfectly matching reports to debug performance issues. Just go where the Lighthouse opportunities lead you.
Now, if you get huge discrepancies (like, 30+ points) in simulated mode, let us know.