lighthouse-ci

lighthouse-ci copied to clipboard
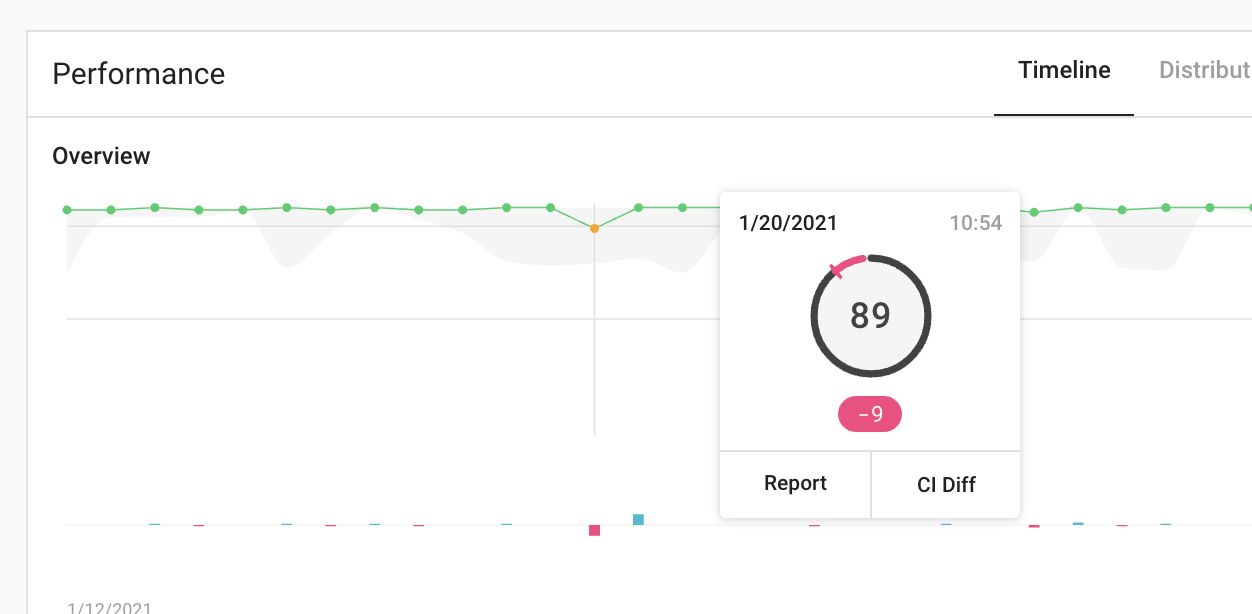
Category summary chart doesn't match up with data
I'm seeing a dip in the chart I can't find in the reports or diffs.
To Reproduce Steps to reproduce the behavior:
- Go to http://lhci-canary.herokuapp.com/app/projects/d1e4b15c-e644-4552-b136-e975f486a2ce/dashboard (web.dev's dashboard)
- Click on
50for most recent 50 commits. (might need to be 100 in a week if web.dev keeps landing commits ;) - See the -9 drop in perf score.
- Try to find the report that shows a perf score of 89.
clicking on "CI diff" brings us here which has no change in the 98 score.
btw I'm happy to investigate this further if I can get some direction on where to go from here. :)
Hm yeah I can reproduce this too. Seems like there was a difference in the median stat compared to the representative run?
That would expectedly produce this result and would need https://github.com/GoogleChrome/lighthouse-ci/issues/235 to resolve. You could manually query the available runs at the API to look into it?