pygmt
 pygmt copied to clipboard
Add Figure.hlines for plotting horizontal lines
As discussed in #670 here's a new module (hlines) to plot a single or a set of horizontal lines with only defining the desired y-value(s). For discussion I only add the module for horizontal lines at the moment, however, the adjustments to prepare the same for vertical lines is done very quickly. Furthermore, currently the whole procedure is performed in a loop since it's not possible to pass multi-segment lines to the plot function so far (except using an input file). Please correct me if I'm wrong.
Reminders
- [ ] Run
make formatandmake checkto make sure the code follows the style guide. - [ ] Add tests for new features or tests that would have caught the bug that you're fixing.
- [ ] Add new public functions/methods/classes to
doc/api/index.rst. - [ ] Write detailed docstrings for all functions/methods.
- [ ] If adding new functionality, add an example to docstrings or tutorials.
Slash Commands
You can write slash commands (/command) in the first line of a comment to perform
specific operations. Supported slash commands are:
/format: automatically format and lint the code/test-gmt-dev: run full tests on the latest GMT development version
@michaelgrund Nice work! I just changed the PR title so that we can focus on one feature Figure.hlines in this PR.
Furthermore, currently the whole procedure is performed in a loop since it's not possible to pass multi-segment lines to the plot function so far (except using an input file).
It's possible to use np.NaN record to separate segments:
import numpy as np
import pygmt

x = np.array([2, 4, 4, np.NaN, 5, 6])
y = np.array([3, 5, 7, np.NaN, 4, 2])

fig = pygmt.Figure()
fig.basemap(region=[0, 10, 0, 10], frame=True)
fig.plot(x, y, pen="2p")
fig.show()
but I'm not sure if other features (lines with different colors) are supported.
Furthermore, currently the whole procedure is performed in a loop since it's not possible to pass multi-segment lines to the plot function so far (except using an input file).
It's possible to use
np.NaNrecord to separate segments:import numpy as np import pygmt x = np.array([2, 4, 4, np.NaN, 5, 6]) y = np.array([3, 5, 7, np.NaN, 4, 2]) fig = pygmt.Figure() fig.basemap(region=[0, 10, 0, 10], frame=True) fig.plot(x, y, pen="2p") fig.show()but I'm not sure if other features (lines with different colors) are supported.
Ok will check that and, if possible, adjust the code.
Furthermore, currently the whole procedure is performed in a loop since it's not possible to pass multi-segment lines to the plot function so far (except using an input file).
It's possible to use
np.NaNrecord to separate segments:import numpy as np import pygmt x = np.array([2, 4, 4, np.NaN, 5, 6]) y = np.array([3, 5, 7, np.NaN, 4, 2]) fig = pygmt.Figure() fig.basemap(region=[0, 10, 0, 10], frame=True) fig.plot(x, y, pen="2p") fig.show()but I'm not sure if other features (lines with different colors) are supported.
I made some adjustments, however, as you mentioned @seisman it's not possible to put different linestyles or colors into plot separated by np.NaN. Thus, I left the for loop as is so far.
Let's start the discussion @GenericMappingTools/pygmt-maintainers 😉.
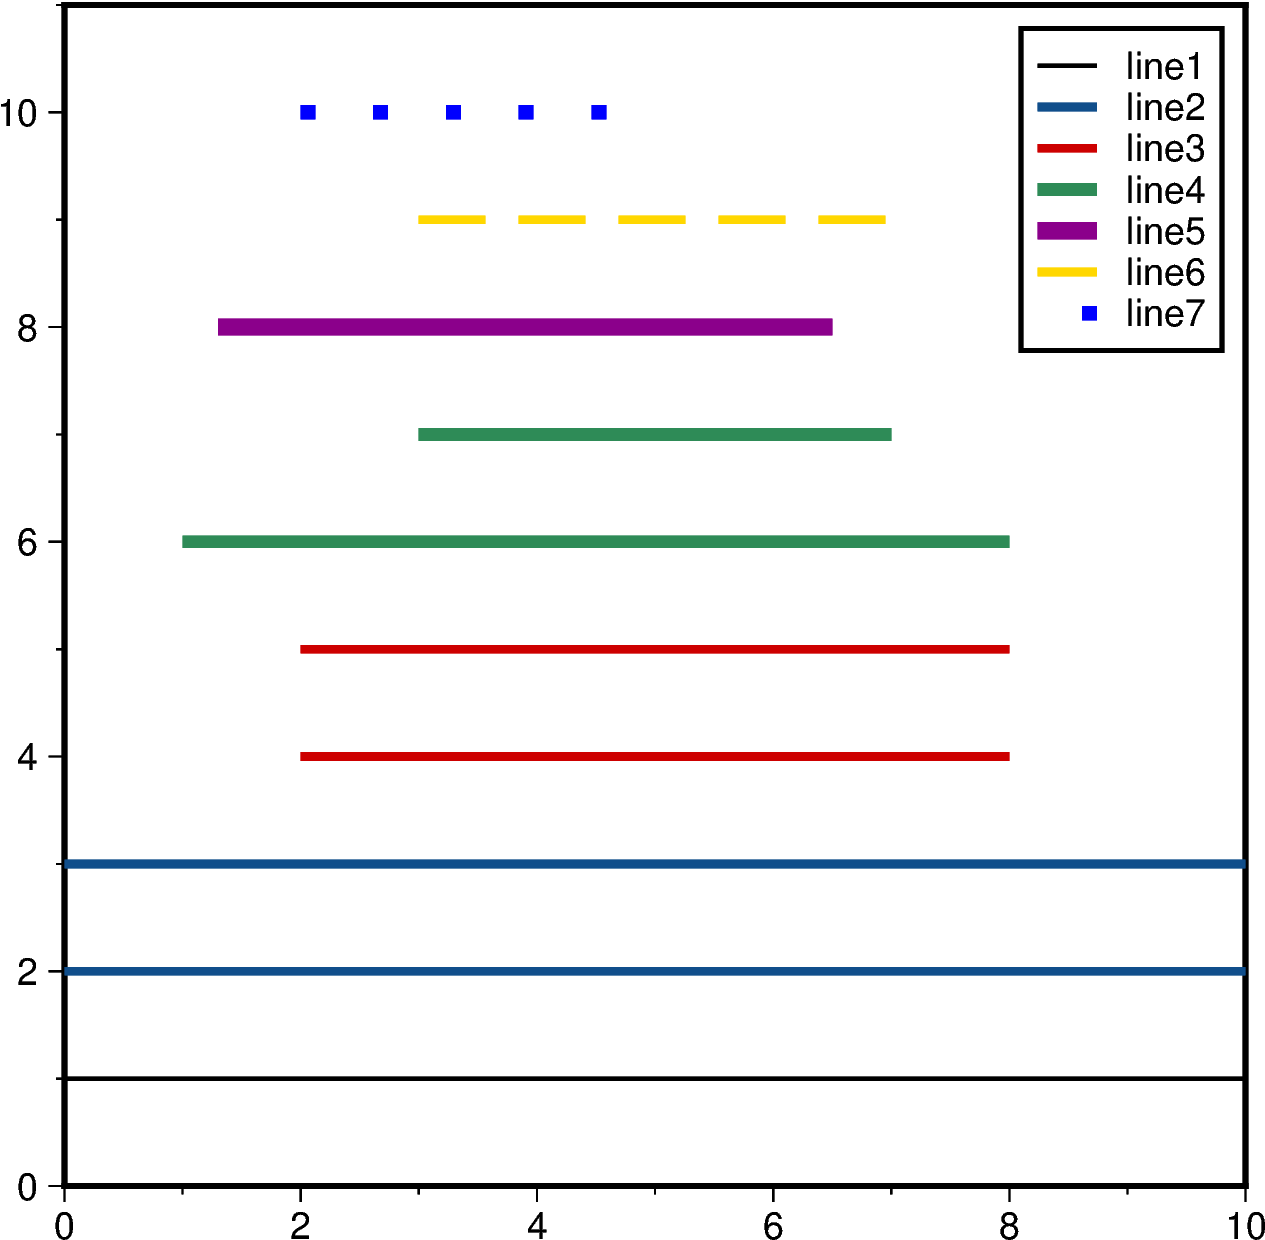
Currently the following cases are covered:
import pygmt

fig = pygmt.Figure()
fig.basemap(region=[0, 10, 0, 11], projection="X10c/10c", frame=True)

# single line with only a label given, xmin and xmax are defined by the map borders
fig.hlines(1, label="line1")
# multiple lines of same style covered under one label
fig.hlines([2, 3], pen="2p,dodgerblue4", label="line2")
# multiple lines of same style covered under one label, both with same defined xmin and xmax
fig.hlines([4, 5], xmin=2, xmax=8, pen="2p,red3", label="line3")
# multiple lines of same style covered under one label, with different defined xmin and xmax
fig.hlines([6, 7], xmin=[1, 3], xmax=[8, 7], pen="3p,seagreen", label="line4")
# multiple lines of different style and labels as well as different defined xmin and xmax
fig.hlines([8, 9, 10],
           xmin=[1.3, 3, 2],
           xmax=[6.5, 7, 5],
           pen=["4p,darkmagenta","2p,gold,--","3.5p,blue,."],
           label=["line5", "line6", "line7"])

fig.legend()
fig.show()
@GenericMappingTools/pygmt-maintainers This PR has been untouched since August; are we planning to get it wrapped up for v0.5.0?
@GenericMappingTools/pygmt-maintainers This PR has been untouched since August; are we planning to get it wrapped up for v0.5.0?
I think the issues raised in https://github.com/GenericMappingTools/pygmt/pull/923#pullrequestreview-737713277 will be a bit tricky to address, so I suggest v0.6.0.
@GenericMappingTools/pygmt-maintainers This PR has been untouched since August; are we planning to get it wrapped up for v0.5.0?
I think the issues raised in #923 (review) will be a bit tricky to address, so I suggest v0.6.0.
@michaelgrund I'm going to bump this back to v0.6.0
@GenericMappingTools/pygmt-maintainers This PR has been untouched since August; are we planning to get it wrapped up for v0.5.0?
I think the issues raised in #923 (review) will be a bit tricky to address, so I suggest v0.6.0.
@michaelgrund I'm going to bump this back to v0.6.0
That's fine @willschlitzer. Totally overlooked the review comments from @meghanrjones. Sorry for that.
@michaelgrund Are you hoping to get this in to the v0.6 release?
Unfortunately not @willschlitzer ... Hope I can continue working on this PR end of February/beginning of March. Set the milestone to v0.7.0.
@michaelgrund I think we should get this feature done in v0.13.0. Are you still interested in working on this PR?
@michaelgrund I think we should get this feature done in v0.13.0. Are you still interested in working on this PR?
Yes I am, after 3 years we should definitely bring this in v0.13.0.