Very slow memory table scan firebird compared to other databases
When comparing speeds between database platforms, we came across a potentially large firebird optimization.
Memory table scan (table pages in memory) speed on MSSQL/Oracle is orders of magnitude faster than on Firebird. Table scan on 10M rows on memory cached table
Firebird 3s
vs.
MSSQL/Oracle 150ms (with parallelization disabled)
HW: Windows Server 2019, Intel Core i7-6700 3,4GHz.
Firebird 3.0.10 (Windows Build) The number of pages is set so that the pages of the table from the example would be in memory. firebird.conf ServerMode = Super DefaultDbCachePages = 300K
Example for isql:
SET TERM ~ ;
CREATE TABLE TEST( ID INTEGER NOT NULL, DATA INTEGER NOT NULL )~
ALTER TABLE TEST ADD CONSTRAINT TESTPK PRIMARY KEY (ID)~
COMMIT~
execute block as DECLARE ROWSCOUNT INT = 10000000; DECLARE I INT = 0; begin WHILE (I < ROWSCOUNT) DO BEGIN INSERT INTO TEST (ID, DATA) VALUES (:I, :I); I = I + 1; END end~ COMMIT~
SET STATs~ SET TIME~ SELECT COUNT(*) FROM TEST WHERE DATA <> -1~
------ Performance info ------ Current memory = 5226917008 Delta memory = 21216 Max memory = 5230496000 Elapsed time= 2.955 sec Buffers = 307200 Reads = 0 Writes = 0 Fetches = 10132030
A partial optimization has probably already been solved in https://github.com/FirebirdSQL/firebird/issues/5636 but the resulting speed of the SCAN operation is still small.
@janjavurekabra , Count() might be optimized for other databases, and does not read the comeplete data. Do not compare Count() but compare complete data fetch to client side.
I don't agree.
In the given example, MSSQL/Oracle also traverses all pages of the table.
For the sake of clarity, I deliberately included reading with a WHERE condition in the example, so MSSQL/Oracle definitely has no chance to make the task any easier.
it is also evident from the duration of the MSSQL/Oracle query, which is not 1ms but 150ms of full CPU load.
There must definitely be a path to optimization. The task can be viewed very simply. Reading 10M rows from memory x comparing INT number should not take 3s but hundreds of ms like on other database platforms.
This is clear.
You forgot to show plans that MSSQL/Oracle used for the query. I bet they used index-only scans.
On the TEST table as shown in the example, there is no INDEX over the DATA column. I am attaching an example for MSSQL:
set statistics time off set statistics IO off SET NOCOUNT ON GO
IF NOT OBJECT_ID('TEST') IS NULL DROP TABLE [TEST] GO
CREATE TABLE [dbo].[TEST]( [ID] [INT] NOT NULL, [DATA] [INT] NOT NULL, CONSTRAINT [TESTPK] PRIMARY KEY ([ID] ASC) ) GO
BEGIN TRANSACTION GO DECLARE @ROWSCOUNT INT = 10000000 DECLARE @I INT = 0 WHILE @I < @ROWSCOUNT BEGIN INSERT INTO [TEST] (ID, DATA) VALUES (@I, @I) SET @I = @I + 1 END GO COMMIT GO
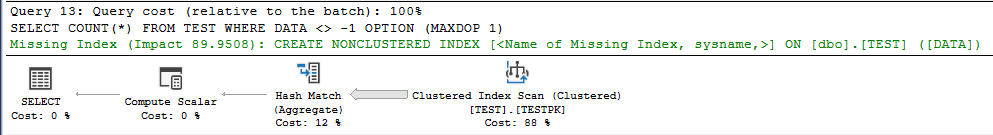
set statistics time on set statistics IO on SELECT COUNT(*) FROM TEST WHERE DATA <> -1 OPTION (MAXDOP 1) GO
Checking the script I found the error in mine. MSSQL only had 1M rows in the script.
The non-optimality of the Firebird is therefore not as great as I stated in the assignment.
I am correcting the entry
Firebird 3s
vs.
MSSQL/Oracle 1427ms (with parallelization disabled)
MSSQL plan is Table 'TEST'. Scan count 1, logical reads 38459, physical reads 0, page server reads 0, read-ahead reads 0, page server read-ahead reads 0, lob logical reads 0, lob physical reads 0, lob page server reads 0, lob read-ahead reads 0, lob page server read-ahead reads 0. SQL Server Execution Times: CPU time = 1437 ms, elapsed time = 1427 ms.
Default Firebird page size is 4k, MS SQL - 8k. Thus smaller number of logical reads.
there is no INDEX over the DATA column
Your plan picture shows opposite: clustered index on test.testpk and as I said, it is index-only scan. Also I suspect that versioning is not turned on.
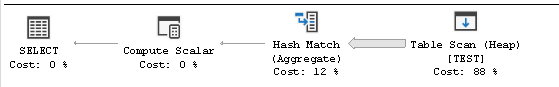
Believe that MSSQL is doing a complete scan of the table contents because the data of the DATA column is not indexed. The same speed is achieved by MSSQL even if there is no primary key and thus the TABLE Scan (Heap) operation is performed.
MSSQL modified script: set statistics time off set statistics IO off SET NOCOUNT ON GO
IF NOT OBJECT_ID('TEST') IS NULL DROP TABLE [TEST] GO
CREATE TABLE [dbo].[TEST]( [ID] [INT] NOT NULL, [DATA] [INT] NOT NULL --without PK CONSTRAINT [TESTPK] PRIMARY KEY ([ID] ASC) ) GO
BEGIN TRANSACTION GO DECLARE @ROWSCOUNT INT = 10000000 DECLARE @i INT = 0 WHILE @i < @ROWSCOUNT BEGIN INSERT INTO [TEST] (ID, DATA) VALUES (@i, @i) SET @i = @i + 1 END GO COMMIT GO
set statistics time on set statistics IO on SELECT COUNT(*) FROM TEST WHERE DATA <> -1 OPTION (MAXDOP 1) GO Table 'TEST'. Scan count 1, logical reads 40161, physical reads 0, page server reads 0, read-ahead reads 0, page server read-ahead reads 0, lob logical reads 0, lob physical reads 0, lob page server reads 0, lob read-ahead reads 0, lob page server read-ahead reads 0. SQL Server Execution Times: CPU time = 1484 ms, elapsed time = 1472 ms.
I have verified that Firebird is equally slow for a page size of 8192 and 4096 . Example: CREATE DATABASE 'c:\nexus\TEST.FDB' PAGE_SIZE 8192 DEFAULT CHARACTER SET WIN1250; Run the above script. Result: SELECT COUNT(*) FROM TEST WHERE DATA <> -1~
COUNT
===================== 10000000
Current memory = 2708375328 Delta memory = 11744 Max memory = 2712142080 Elapsed time= 2.991 sec Buffers = 307200 Reads = 0 Writes = 0 Fetches = 10264948
CREATE DATABASE 'c:\nexus\TEST.FDB' PAGE_SIZE 4096 DEFAULT CHARACTER SET WIN1250; SELECT COUNT(*) FROM TEST WHERE DATA <> -1~
COUNT
===================== 10000000
Current memory = 1455431760 Delta memory = 11744 Max memory = 1460876592 Elapsed time= 3.092 sec Buffers = 307200 Reads = 0 Writes = 0 Fetches = 10533505
Conclusion
MSSQL is 2x faster in TABLE SCAN operation when comparing INT values.
Firebird 3s for 16K so for 8K and 4K page size MSSQL 1.5s
Firebird compresses data on pages and this cannot be disabled. It saves disk space but spends CPU cycles on reading.
Firebird compresses data on pages and this cannot be disabled. It saves disk space but spends CPU cycles on reading.
Dmitry thank you for your reply. If this is indeed the case, it explains the higher CPU load and longer overall execution time.
My guess is that this is not an easy path to optimization.
For example, MSSQL uses parallelization for such queries to achieve faster response. Maybe that would be the easiest way to speed up Firebird without changing access to compressed pages in memory.
Firebird compresses data on pages and this cannot be disabled. It saves disk space but spends CPU cycles on reading.
But it read here from memory, so no compression i think? Compresion is on disk pages? Or it is fetched unmodified into the memory?
Compresion is on disk pages?
Compression is on records. But in case of count it shouldn't matter.
Compression is on records. But in case of count it shouldn't matter.
Did you miss the WHERE DATA condition?
Just to add a data point to this. Recently had request to see if could improve one of the lookup screens of our application. It took about 7 seconds to load which is fine but it is frequently accessed. So looked at the query and majority of time was just reading the base table without any joins.
Did a test with Firebird 5.0.0.1306, Sqlite and Postgresql 16 on windows with NVME ssd. 2 000 000 rows with generated data.
Results: Firebird 4.6821693 seconds SQLite 1.9143469 seconds PostgreSQL 1.241624 seconds
Firebird result is best result after tweaking all the usual settings (DefaultDbCachePages = 300K, Wire Compression = false)
The table stores stock levels per item per warehouse. Schema and Query was exactly the same for the 3 database engines. PostgreSQL,SQLite config was the default without tweaks. Tested using .net drivers and read the first two columns of every row.
Schema:
CREATE TABLE STOCK_WAREHOUSE_LEVEL
(
  WAREHOUSELEVELNO                            INTEGER,
  STOCKNO                                     INTEGER,
  UNITNO                                      INTEGER,
  WAREHOUSENO                                 INTEGER,
  QUANTITY_ON_HAND                            DECIMAL( 14, 6),
  QUANTITY_RESERVED                           DECIMAL( 14, 6),
  QUANTITY_AVAILABLE                          DECIMAL( 14, 6),
 PRIMARY KEY (WAREHOUSELEVELNO)
);
Query:
SELECT * FROM STOCK_WAREHOUSE_LEVEL
Firebird plan:
Select Expression
    -> Table "STOCK_WAREHOUSE_LEVEL" Full Scan
Is this fresh started query or hot one with data in the cache?
If it is fresh, the maybe Firebird read page by page from SSD, and other RDBS ask for bigger continuous block. Just guess…
Regards, Karol Bieniaszewski
Od: Gerdus van Zyl Wysłano: piątek, 22 marca 2024 16:10 Do: FirebirdSQL/firebird DW: Karol Bieniaszewski; Comment Temat: Re: [FirebirdSQL/firebird] Very slow memory table scan firebirdcompared to other databases (Issue #7478)
Just to add a data point to this. Recently had request to see if could improve one of the lookup screens of our application. It took about 7 seconds to load which is fine but it is frequently accessed. So looked at the query and majority of time was just reading the base table without any joins. Did a test with Firebird 5.0.0.1306, Sqlite and Postgresql 16 on windows with NVME ssd. 2 000 000 rows with generated data. Results: Firebird 4.6821693 seconds SQLite 1.9143469 seconds PostgreSQL 1.241624 seconds Firebird result is best result after tweaking all the usual settings (DefaultDbCachePages = 300K, Wire Compression = false) The table stores stock levels per item per warehouse. Schema and Query was exactly the same for the 3 database engines. PostgreSQL,SQLite config was the default without tweaks. Tested using .net drivers and read the first two columns of every row. Schema: CREATE TABLE STOCK_WAREHOUSE_LEVEL ( WAREHOUSELEVELNO INTEGER, STOCKNO INTEGER, UNITNO INTEGER, WAREHOUSENO INTEGER, QUANTITY_ON_HAND DECIMAL( 14, 6), QUANTITY_RESERVED DECIMAL( 14, 6), QUANTITY_AVAILABLE DECIMAL( 14, 6), PRIMARY KEY (WAREHOUSELEVELNO) ); Query: SELECT * FROM STOCK_WAREHOUSE_LEVEL Firebird plan: Select Expression -> Table "STOCK_WAREHOUSE_LEVEL" Full Scan — Reply to this email directly, view it on GitHub, or unsubscribe. You are receiving this because you commented.Message ID: @.***>
@gerdus What are the settings for FileSystemCacheThreshold and UseFileSystemCache ? If UseFileSystemCache is unset and DefaultDbCachePages > FileSystemCacheThreshold then your tests will have run with the file system cache disabled.
@livius2 I run the query 5 times in a loop so it should be in cache.
@reevespaul UseFileSystemCache = true DefaultDbCachePages = 300K FileSystemCacheThreshold = 1K 4.72 seconds
UseFileSystemCache = false DefaultDbCachePages = 300K FileSystemCacheThreshold = 800K 4.70 seconds
unset commented out UseFileSystemCache DefaultDbCachePages = 300K FileSystemCacheThreshold = 800K 4.69 seconds
Hello,
The questions to all who did testes - can you please tell what were the appropriate sizes of databases in Firebird, MSSQL, PostgreSQL?
Regards, Alexey Kovyazin
on my 2 million row test: PostgreSQL: 165.52 MB Firebird 4: 190.4MB Firebird 5: 216.35MB SQlite: 39.9MB