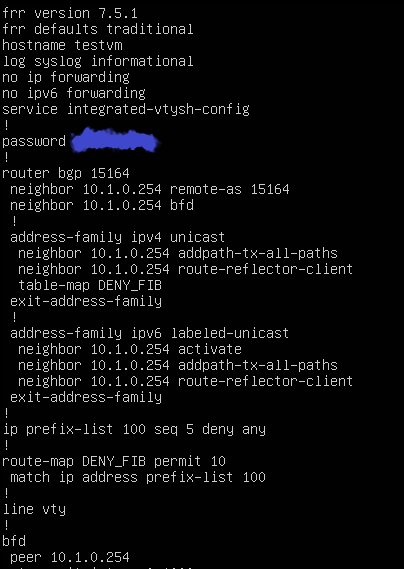
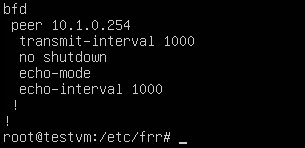
frr
 frr copied to clipboard
IPv6 labeled-unicast 6PE for Internet scale -- high CPU usage
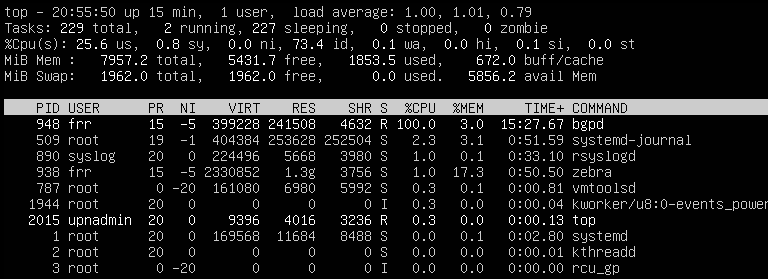
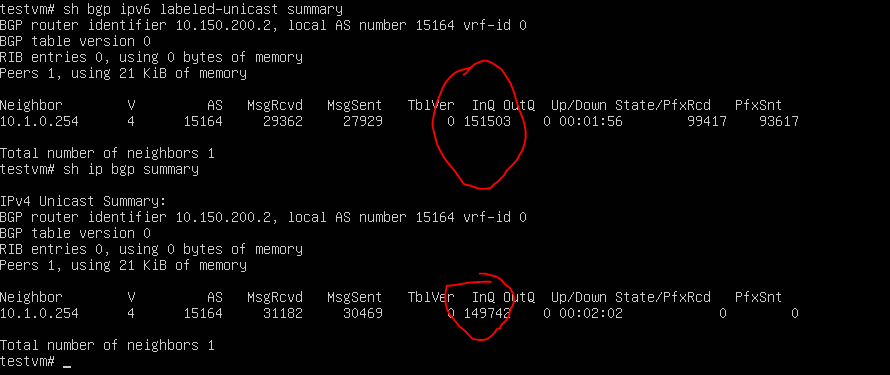
Hello, We utilize 6PE to support IPv6 internet traffic over an IPv4 based MPLS network. When I try to establish IPv6 labeled-unicast with one of the core router, I can see that it's learning the full Internet IPv6 table with appropriate MPLS label assigned to those routes. However, the CPU usage spikes to 100% and InQ won't clear fast enough for IPv6 labeled-unicast and IPv4 unicast sessions. I have tried versions 7.5 and 8.3(current)
Not sure if 6PE at internet scale is support by FRR or if I'm doing something wrong here. I have attached some screen shots of config, cpu usage and show commands.
I have tried removing IPv4 unicast session, BFD config and see if IPv6 labeled-unicast would work with bare minimum config, but that did not change the behavior.
I would really appreciate any help here.
https://github.com/FRRouting/frr/wiki/Perf-Recording can we get a flame-graph for bgpd and zebra?
Same issue here. When working only with ipv4/ipv6 unicast it works fine. When enabling ipv6-labeled-unicast the CPU goes high
@mauroalx -> Can you gather the flame-graph as outlined in the perf-recording? Alternatively can you send me a ipv6 labeled unicast feed? ( we can work off github to get this done ).
I was able to recreate a perf issue( probably the same but we'll see ).
  45.29%  libfrr.so.0.0.0  [.] skiplist_insert
   3.24%  bgpd             [.] get_label_from_pool
   0.31%  [kernel]         [k] delay_halt_mwaitx
   0.22%  bgpd             [.] skiplist_insert@plt
   0.04%  libc-2.31.so     [.] __memset_avx2_unaligned_erms
   0.01%  [kernel]         [k] get_obj_cgroup_from_current
   0.01%  libfrr.so.0.0.0  [.] hash_walk
   0.01%  [kernel]         [k] native_read_msr
   0.01%  [kernel]         [k] __kmalloc_node_track_caller
   0.01%  [kernel]         [k] __const_udelay
   0.01%  libfrr.so.0.0.0  [.] stream_put
   0.01%  [kernel]         [k] wait_for_unix_gc
   0.01%  [kernel]         [k] __virt_addr_valid
   0.01%  [kernel]         [k] timekeeping_advance
   0.01%  bgpd             [.] bgp_node_match```

effectively as bgp needs label it requests labels from zebra.  Zebra gives a group of labels from say 1000-1999  this is added as a lp_chunk.  Then we allocate labels by walking all lp_chunks starting at the first one and checking if the first label is used( 1000) it's not so it is added to the inuse skiplist.
The second prefix needs a label so the get_label_from_pool gets the first chunk, looks at label 1000 tries to insert into the skiplist, see's it's already in the inuse skiplist and then goes to 1001.  Which is attempted to be installed and it succeeds.

Now once the first chunk is completely filled up, bgp will request another chunk from zebra, which will return 2000-2999.  When another prefix needs a label the search will start in the first chunk( all the skiplist_inserts will fail ) and then look at the second chunk.  The first item will not be in the inuse skiplist and as such it will install.

This algorithm is especially slow when attempting to get anything with a large number of routes in the labeled unicast table
when I was testing this behavior last night, I noticed that bgp was restarting every 25-30 minutes because watchfrr was unable to get to it due to the performance issue. I suspect if we were to allow bgp to actually come up performance would probably stablize as it was able to digest the feed. Can either of you do a watchfrr ignore bgpd and see if it eventually comes up? ( In my test bed it did so )
when I was testing this behavior last night, I noticed that bgp was restarting every 25-30 minutes because watchfrr was unable to get to it due to the performance issue. I suspect if we were to allow bgp to actually come up performance would probably stablize as it was able to digest the feed. Can either of you do a
watchfrr ignore bgpdand see if it eventually comes up? ( In my test bed it did so )
@donaldsharp Sorry for not tried perf recording. Running watchfrr ignore bgpd I realized some performance improvement, but it still slow. I noticed too that Juniper (MX Series) firstly process IPV4 routes then IPV6, this may help about performance issue. Nevertheless, FRR works like a charm.
Below log is outputted when I restart sessions or when I set up a new one.
2022/08/23 09:26:24 [PHJDC-499N2][EC 100663314] STARVATION: task vtysh_rl_read (561e503bfcc0) ran for 5403ms (cpu time 3ms)"
If perf record is still useful, I'll send it soon.
yes a perf record would still be good. The watchfrr ignore bgpd is just to allow everything to stabilize after a fairly long time
yes a perf record would still be good. The
watchfrr ignore bgpdis just to allow everything to stabilize after a fairly long time
Even following the Wiki instructions I'm stuck when generating records.
When I run perf top --call-graph=dwarf -p 702 as unprivileged user, I got the following message
│Access to performance monitoring and observability operations is limited. │
│Consider adjusting /proc/sys/kernel/perf_event_paranoid setting to open │
│access to performance monitoring and observability operations for processes│
│without CAP_PERFMON, CAP_SYS_PTRACE or CAP_SYS_ADMIN Linux capability. │
│More information can be found at 'Perf events and tool security' document: │
│https://www.kernel.org/doc/html/latest/admin-guide/perf-security.html │
│perf_event_paranoid setting is -1: │
│ -1: Allow use of (almost) all events by all users │
│ Ignore mlock limit after perf_event_mlock_kb without CAP_IPC_LOCK │
│>= 0: Disallow raw and ftrace function tracepoint access │
│>= 1: Disallow CPU event access │
│>= 2: Disallow kernel profiling │
│To make the adjusted perf_event_paranoid setting permanent preserve it │
│in /etc/sysctl.conf (e.g. kernel.perf_event_paranoid =
I adjusted perf_event_paranoid to -1, 0 and 1 (rebooted also) but it has the same behavior.
When running it as root I got the following message and the perf top is exited.
addr2line /usr/lib/x86_64-linux-gnu/frr/libfrr.so.0.0.0: could not read first record
ENV
Linux RR-FRR 5.18.0-4-amd64 #1 SMP PREEMPT_DYNAMIC Debian 5.18.16-1 (2022-08-10) x86_64 GNU/Linux