f5-telemetry-streaming
 f5-telemetry-streaming copied to clipboard
Telemetry streaming statistics
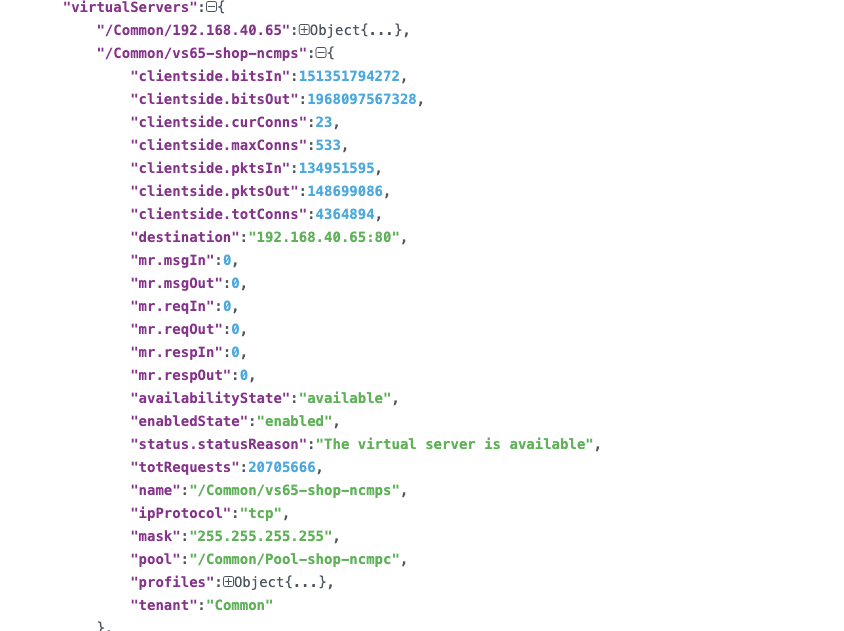
Question 1: I want to see the CPU metrics for each virtual server. As shown in the figure below:

Question 2:
Currently, module statistics and performance reports information in F5 statistics is very useful, but there is no such data in telemetry streaming.
As shown in the figure below:
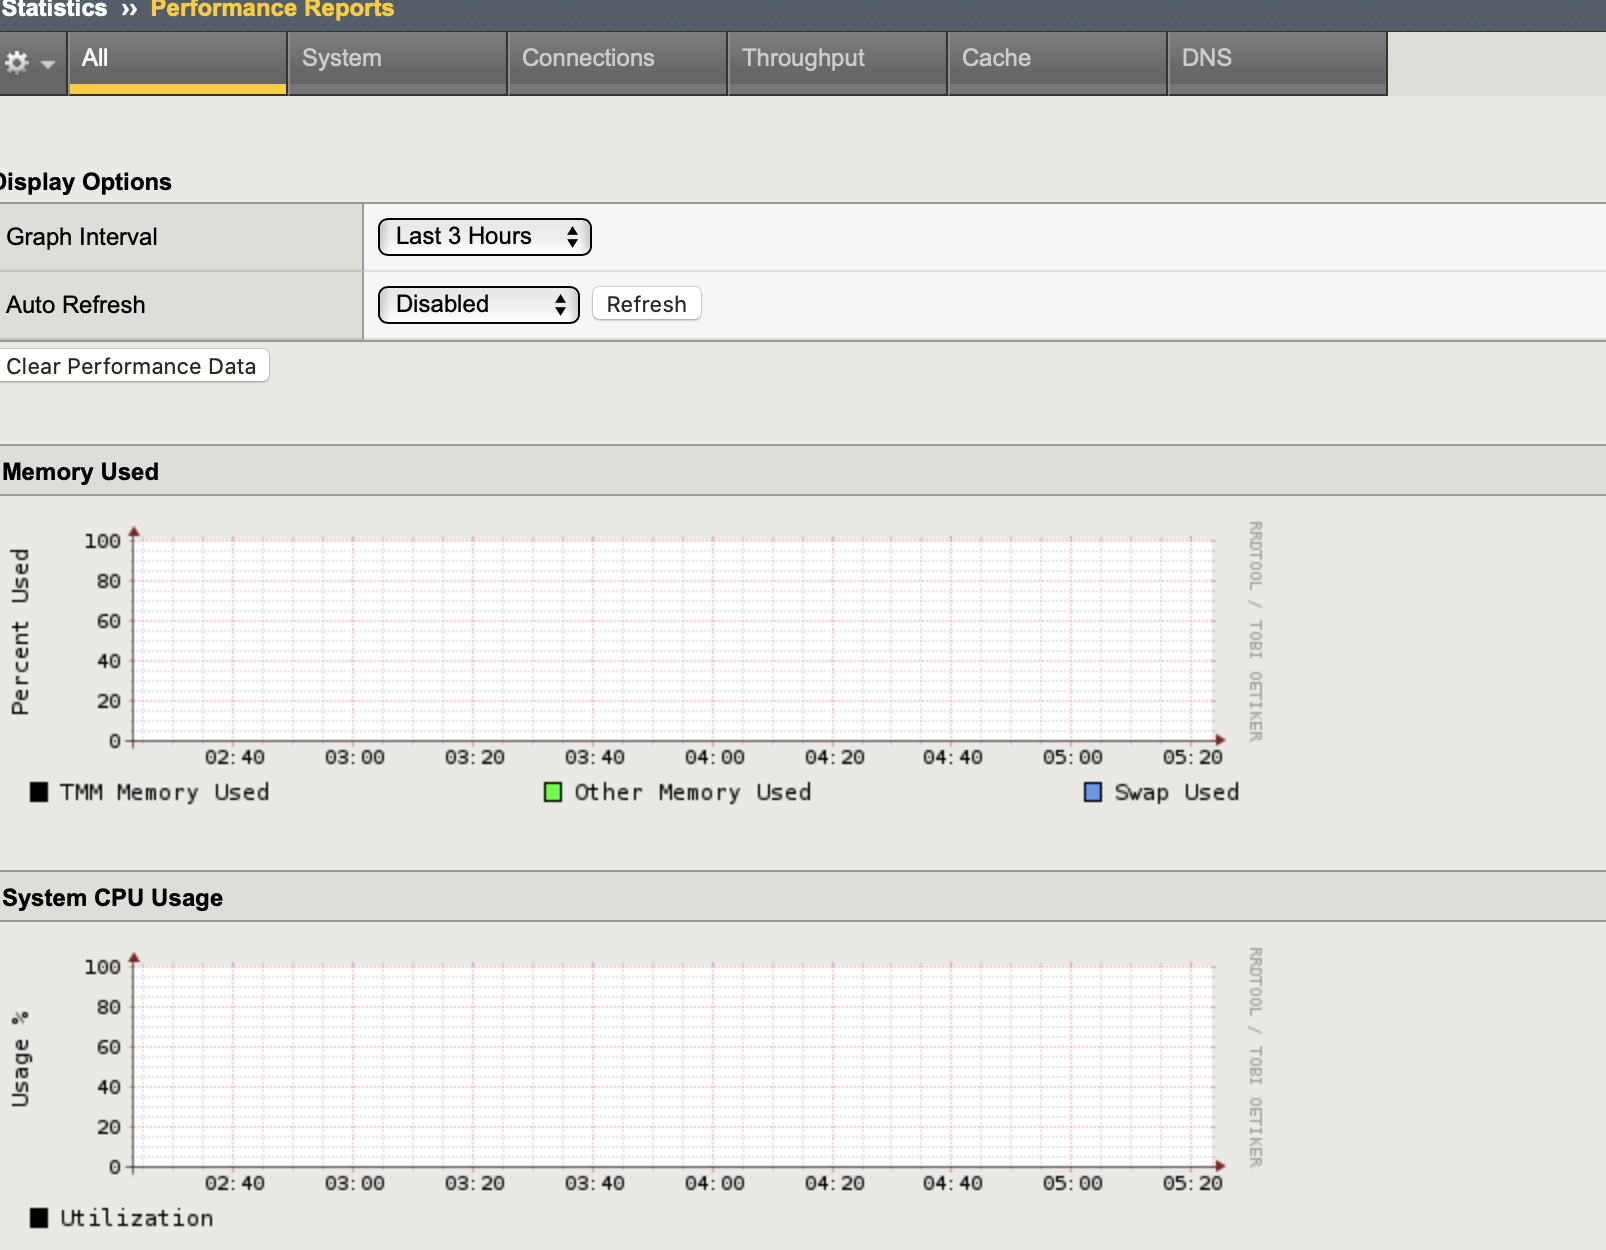
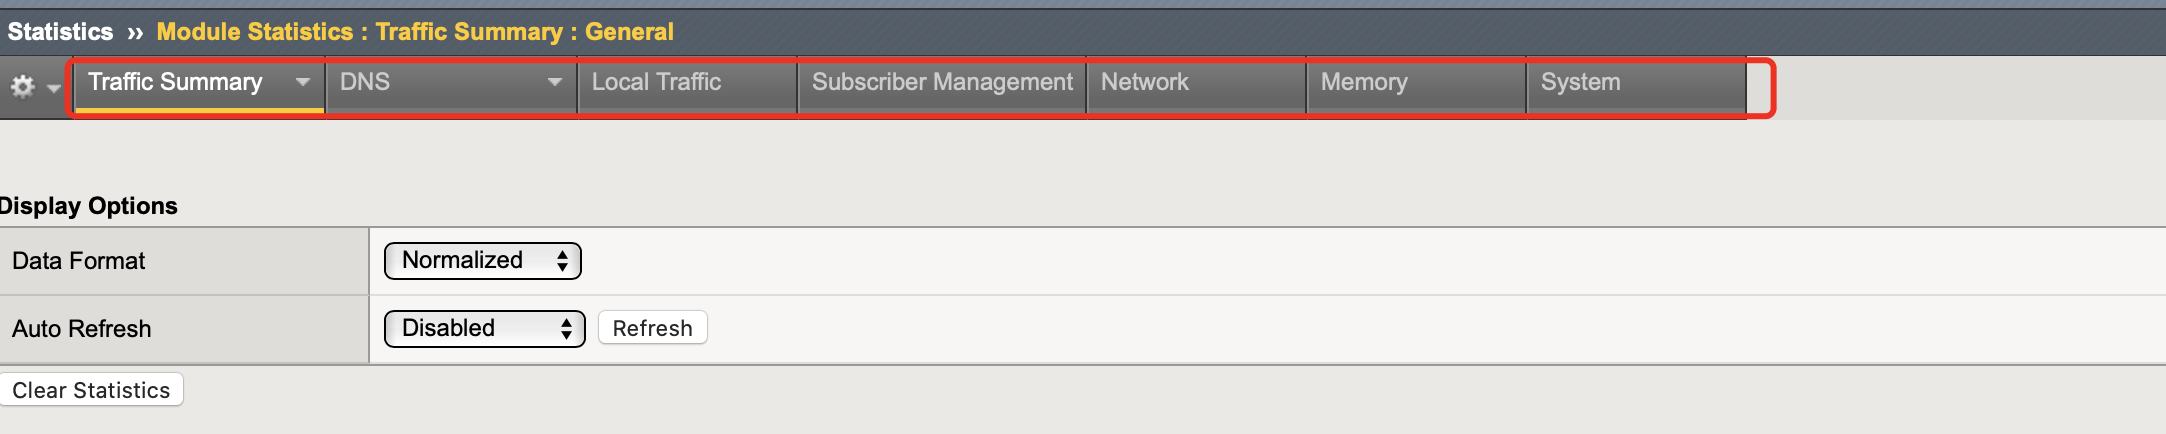
This information is very important to me. I don't support it at present. Will you consider adding this function later
Do you mean the 5 sec, 1 min, and 5 min break down data?
Yes。I can't see the data
Data collection in this method doesn't really make sense. If you wanted more granular sampling of this information you would increase the polling rate of the system poller (which would generate a lot more data than necessary) or you configure a custom poller with an "include" that only grabs CPU data every 5 seconds or your required intervals. You would then use summarization/aggregation to report this information. The burden of interval roll-up has shifted in this case.
Data collection in this method doesn't really make sense. If you wanted more granular sampling of this information you would increase the polling rate of the system poller (which would generate a lot more data than necessary) or you configure a custom poller with an "include" that only grabs CPU data every 5 seconds or your required intervals. You would then use summarization/aggregation to report this information. The burden of interval roll-up has shifted in this case.
I need to know the CPU usage of each vs, not that of the whole device
In this way, I can determine which vs takes up more CPU
I double checked the debug logs from TS for Splunk multiMetric consumer and the only virtual server level stats that are reported:
- metric_name:totRequests
- metric_name:clientside.*
- metric_name:serverside.*
- metric_name:mr.*
Looking at BIG-IP REST API directly the CPU usage data is present /mgmt/tm/ltm/virtual/<vs_name>/stats
I see that you opened previously https://github.com/F5Networks/f5-telemetry-streaming/issues/121
However the request still does not follow the formatting guidelines for bugs or new features. These templates are present when submitting new issues. You might want to edit this post using those templates as a guide.
Looking at BIG-IP REST API directly the CPU usage data is present / mgmt/tm/ltm/virtual/<vs_name>/stats
In addition to getting vs CPU metrics through the reset API. TS is not available now, is it?
I see that you opened previously #121
However the request still does not follow the formatting guidelines for bugs or new features. These templates are present when submitting new issues. You might want to edit this post using those templates as a guide.
I'm sorry. I thought I didn't submit successfully. #121
I now configure TS output to fluentd, but I want to get the CPU metric of each vs. Through the query clouddocs, I didn't find the answer I wanted, so I asked questions here. consumer config: { "class": "Telemetry", "My_System": { "class": "Telemetry_System", "systemPoller": { "interval": 60 } }, "My_Listener": { "class": "Telemetry_Listener", "port": 6514 }, "My_Consumer": { "class": "Telemetry_Consumer", "type": "Generic_HTTP", "host": "192.168.40.239", "protocol": "http", "port": 9880, "path": "/fluentd.tag", "method": "POST", "headers": [ { "name": "content-type", "value": "application/json" } ] } }
fluentd output:
Can you be more specific about which properties you want to collect? I have provided an example iControl REST response to show available fields.
{
  "kind": "tm:ltm:virtual:virtualstats",
  "generation": 25490,
  "selfLink": "https://localhost/mgmt/tm/ltm/virtual/test/stats?ver=16.1.0",
  "entries": {
    "https://localhost/mgmt/tm/ltm/virtual/~Common~test/stats": {
      "nestedStats": {
        "kind": "tm:ltm:virtual:virtualstats",
        "selfLink": "https://localhost/mgmt/tm/ltm/virtual/~Common~test/stats?ver=16.1.0",
        "entries": {
          "clientside.bitsIn": {
            "value": 0
          },
          "clientside.bitsOut": {
            "value": 0
          },
          "clientside.curConns": {
            "value": 0
          },
          "clientside.evictedConns": {
            "value": 0
          },
          "clientside.maxConns": {
            "value": 0
          },
          "clientside.pktsIn": {
            "value": 0
          },
          "clientside.pktsOut": {
            "value": 0
          },
          "clientside.slowKilled": {
            "value": 0
          },
          "clientside.totConns": {
            "value": 0
          },
          "cmpEnableMode": {
            "description": "all-cpus"
          },
          "cmpEnabled": {
            "description": "enabled"
          },
          "csMaxConnDur": {
            "value": 0
          },
          "csMeanConnDur": {
            "value": 0
          },
          "csMinConnDur": {
            "value": 0
          },
          "destination": {
            "description": "192.0.2.0:443"
          },
          "ephemeral.bitsIn": {
            "value": 0
          },
          "ephemeral.bitsOut": {
            "value": 0
          },
          "ephemeral.curConns": {
            "value": 0
          },
          "ephemeral.evictedConns": {
            "value": 0
          },
          "ephemeral.maxConns": {
            "value": 0
          },
          "ephemeral.pktsIn": {
            "value": 0
          },
          "ephemeral.pktsOut": {
            "value": 0
          },
          "ephemeral.slowKilled": {
            "value": 0
          },
          "ephemeral.totConns": {
            "value": 0
          },
          "fiveMinAvgUsageRatio": {
            "value": 0
          },
          "fiveSecAvgUsageRatio": {
            "value": 0
          },
          "mr.msgIn": {
            "value": 0
          },
          "mr.msgOut": {
            "value": 0
          },
          "mr.reqIn": {
            "value": 0
          },
          "mr.reqOut": {
            "value": 0
          },
          "mr.respIn": {
            "value": 0
          },
          "mr.respOut": {
            "value": 0
          },
          "tmName": {
            "description": "/Common/test"
          },
          "oneMinAvgUsageRatio": {
            "value": 0
          },
          "status.availabilityState": {
            "description": "unknown"
          },
          "status.enabledState": {
            "description": "enabled"
          },
          "status.statusReason": {
            "description": "The children pool member(s) either don't have service checking enabled, or service check results are not available yet"
          },
          "syncookieStatus": {
            "description": "not-activated"
          },
          "syncookie.accepts": {
            "value": 0
          },
          "syncookie.hwAccepts": {
            "value": 0
          },
          "syncookie.hwSyncookies": {
            "value": 0
          },
          "syncookie.hwsyncookieInstance": {
            "value": 0
          },
          "syncookie.rejects": {
            "value": 0
          },
          "syncookie.swsyncookieInstance": {
            "value": 0
          },
          "syncookie.syncacheCurr": {
            "value": 0
          },
          "syncookie.syncacheOver": {
            "value": 0
          },
          "syncookie.syncookies": {
            "value": 0
          },
          "totRequests": {
            "value": 0
          }
        }
      }
    }
  }
}
It looks like there is no "current" CPU usage, so the best we could probably do is to use the 5 second average as one.
Yes, that is a tricky problem as the sampling interval for CPU does not always match with how the System Poller is defined with respect to TS. It would take a bit more work, but would it make sense to use the 5s, 1m, 5m value based on the interval of the system poller (as a dynamic window)? So.. if the System Poller is anything less than 1 minute sampling, use the 5 second value. 1-5 minutes, then use the 1 minute value and anything over 5 minutes, use the 5 minute value?
I'm not sure if you are trying to normalize the CPU data to 1 counter value. If not, would there be a harm in always reporting the 3 CPU values?
Since we already have enough issues with the size of the Telemetry Streaming payload, I would rather expose this data as one value instead of 3.
The amount of work to expose the 5 second average is considerably less than trying to dynamically pick a value based on the polling interval. Do you see a problem with using that value for all polling intervals?
The problem is the law of averages since the 5second value will only be reported for a narrow slice in time. I would dare say that the 1 min average should be used as the best of blend. On my system TS is configured for 2minute polling windows. Using the 1 minute counter would be able to observe spikes in traffic sufficiently. The 5minute resolution is probably to worst option if traffic spikes are short lived.