Possible to see the current hyperparameters for pipeline on Dask WebUI?
When training TPOT using Dask, you can navigate to the WebUI on port 8786, and see an output like this:
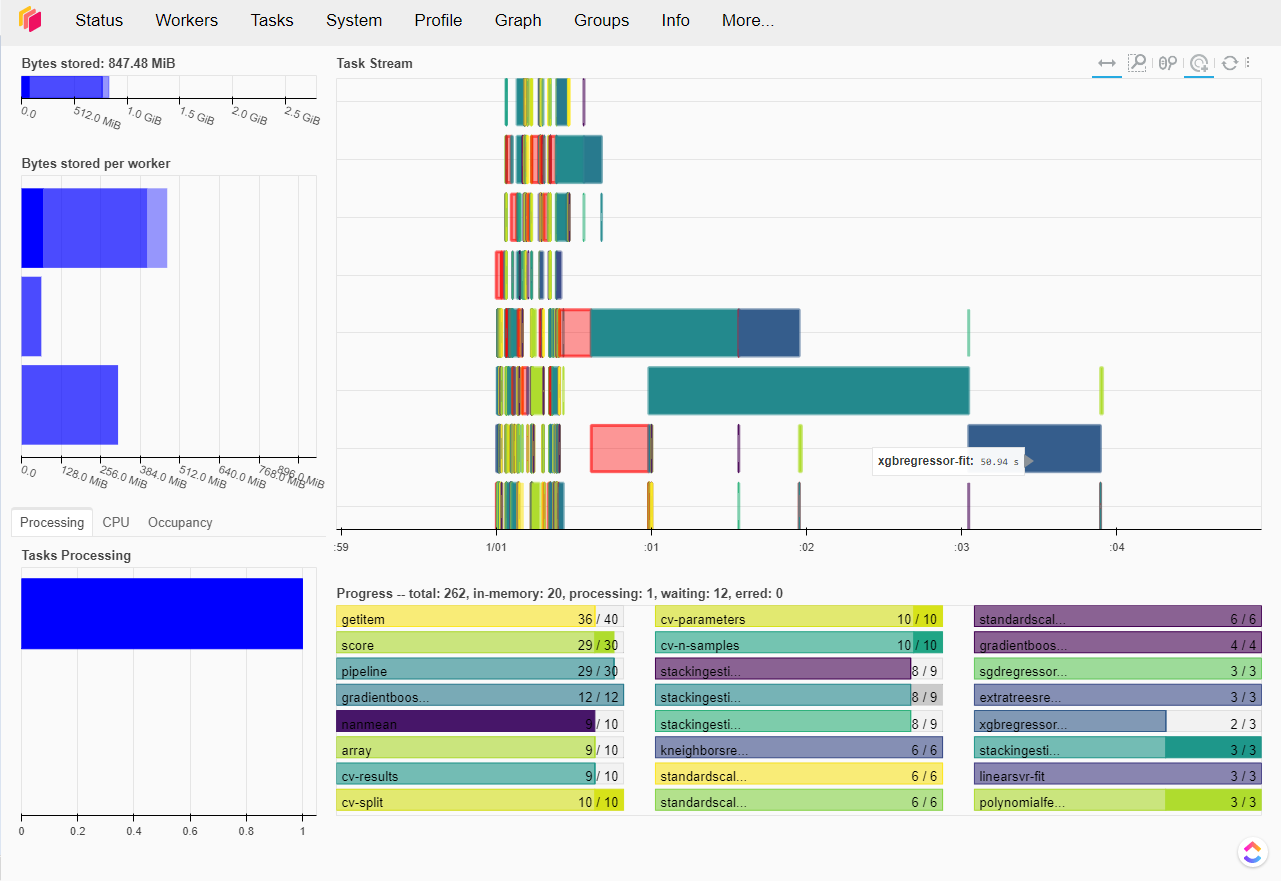
...which lets you monitor the scheduled tasks. Which is cool!
What I'm noticing however, is that some pipelines take FOREVER to run. I know this is dependent on the size of the dataset, the depth/complexity of the current pipeline, etc., but I'm finding that there's usually 1 pipeline that takes a long time to complete, and the next generation is stuck waiting for that one pipeline to finish first. Example, I have 100 population size, 99 of them are done in 5 minutes, but it takes 1 pipeline 15+ minutes to finish...
I have set the max_eval_time_mins=1 to not consider pipelines that take too long, however this isn't respected DURING training, the pipeline is only disregarded AFTER it's done training, so you still have to wait for it to finish.
I notice that there's a trend with some usual culprits (i.e. any CV regressor or randomforest regressor), but rather than excluding those regressor's from my config_dict altogether, I thought it would be cool to monitor what the current hyperparameters are that are causing them to take so much time, so I can modify that regressor's search space a bit. Is this possible on the Dask dashboard somehow, in one of the other (many) tabs?
Example, the default search space for RandomForestRegressor is this:
    'sklearn.ensemble.RandomForestRegressor': {
        'n_estimators': [100],
        'max_features': arange(0.05, 1.01, 0.05),
        'min_samples_split': range(2, 21),
        'min_samples_leaf': range(1, 21),
        'bootstrap': [True, False]
    },
Common sense would assume that, the higher the number of splits, number of features, etc. would attribute to higher training times, but rather than playing trial and error for each of these hyperparams for each of the slow regressors, it would be cool to see a print out/visualize the current pipeline's attributes to make it easier.
I've tried looking through a few of the tabs on the WebUI and turned verbosity=3, but didn't see the details for the pipelines that I'm looking for. Any ideas?