Visualization of fit components
I've been trying to visualize the (serial) component parts of my equivalent circuit to make it easier to show differences between datasets.
Here's some simple code that simulates and plots each component separately from the others. It splits the circuit string on '-' and simulates each component separately from an input list of variables called results.
import numpy as np
import matplotlib.pyplot as plt
from impedance.models.circuits import CustomCircuit

circuit_string = 'R3-CPE3-p(CPE0,R0,L0)-p(CPE1,R1)-p(CPE2,R2)'
components = circuit_string.split('-')

results = [3.94,0.36,0.74,0.0002737,0.869,0.572,0.0688,0.0001392,0.5610,2.821,0.000475,0.777,18.677]
len(results)
var_num = 0

tot_circ = CustomCircuit(circuit_string, initial_guess=results)

fig, ax = plt.subplots()

tot_Z = tot_circ.predict(np.logspace(5,-2))
ax.plot(tot_Z.real, -tot_Z.imag)


for c in components:

    comp = c.split(',')
    comp_len = len(comp) + c.count('CPE') #+ c.count('La') + c.count('Wo') + c.count('Ws') #+ ... # In case I want to add other multi-
    #variable components later
    init_var_num = var_num                # Defines starting point in the list of results
    var_num = var_num + comp_len          # Defines end-point in the list of results

    print(c)
    print(results[init_var_num:var_num])
    sub_circ = CustomCircuit(c, initial_guess=results[init_var_num:var_num])
    Z = sub_circ.predict(np.logspace(5,-2))

    # Code for shifting Z along Z' needs to go here

    if isinstance(Z[0], np.ndarray):
        ax.plot(Z[0].real, -Z[0].imag, '.', label=f'{c}')
    else: ax.plot(Z.real, -Z.imag, '.', label=f'{c}')
plt.legend()
This works ok, and I can use it (or a similar approach) to visualize the same component across different results. This code could probably be adapted quite easily to take the output from fit() instead of a list of results, similar to lmfits eval_components.
The next step would be to show where in the full Nyquist plot each component appears, so I can easily show how they make up the complete plot. Any suggestions on how I might achieve this?
This is a great idea for a feature to add to make visualizing the components that make up a circuit fit. It looks like you're working on some ideas over in your fork. Once you've got the idea refined to what you were thinking, feel free to open a PR and we can get it reviewed and potentially merged into impedance.py. Is there an example visualization you can share here, so folks know what the final goal would look like?
Sure thing. Here's an example of what the output looks like with a simple 2-RC loop circuit:
import pandas as pd
import numpy as np
import matplotlib.pyplot as plt
from impedance.models.circuits import CustomCircuit

# Inputs for componentFitting function
circuit_string = 'R3-p(C1,R1)-p(C2,R2)-W'
components = circuit_string.split('-')
results = [4,0.0001,3,0.0005,20,5]

# Make a DataFrame of fitted components:
predict_parts = pd.DataFrame(componentFitting(circuit_string, results, circuit_name='complete circuit'))

# Plot stuff:
fig, ax = plt.subplots()
cols = predict_parts.columns
for b, c in enumerate(cols[1:]):
    ax.plot(np.real(predict_parts[f'{c}']), -np.imag(predict_parts[f'{c}']), 'o', color=f'C{b}', label=f'{c}')
    ax.plot(np.real(predict_parts[f'{c}']), -np.imag(predict_parts[f'{c}']), color=f'C{b}')

plt.xlabel(r'$Z_{Re}$', fontsize=16)
plt.ylabel(r'$Z_{Im}$', fontsize=16)
plt.axis('square')
plt.grid()
plt.legend()
Output looks like this:
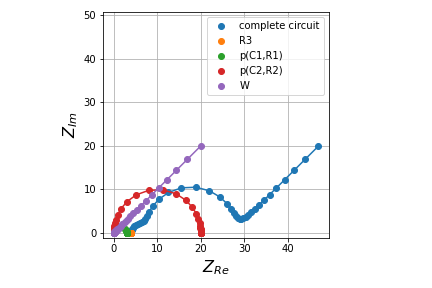
In the above example componentFitting() is the function that is posted to my fork.
Unfortunately the function currently fails for series components inside parallels, e.g. 'p(C0,R0-W)' , and nested parallel components e.g. 'p(p(C0,R0),p(C1,R1))' (super simple example given here, I know it's not a circuit you'd use irl)
I'm looking into maybe using something like parse_circuit() (from buildCircuit()) to determine how to parse stuff inside parentheses, but I don't yet understand how buildCircuit knows how to treat nested parallel circuits.