yellowbrick
 yellowbrick copied to clipboard
Topic Saliency and Relevancy Frequency Distribution
Describe the solution you'd like
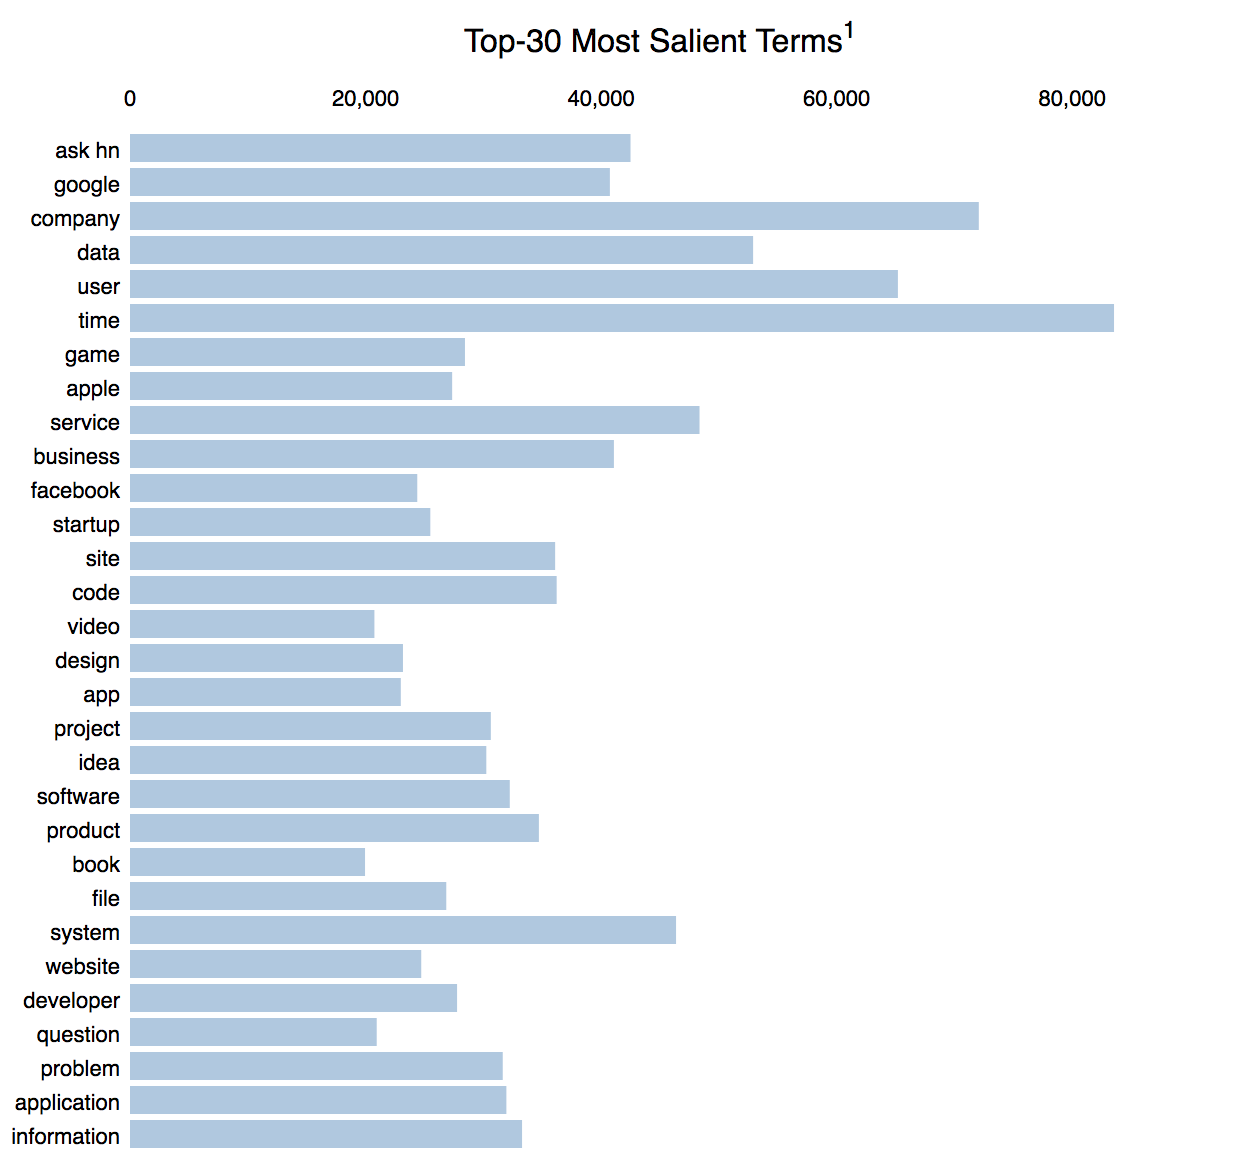
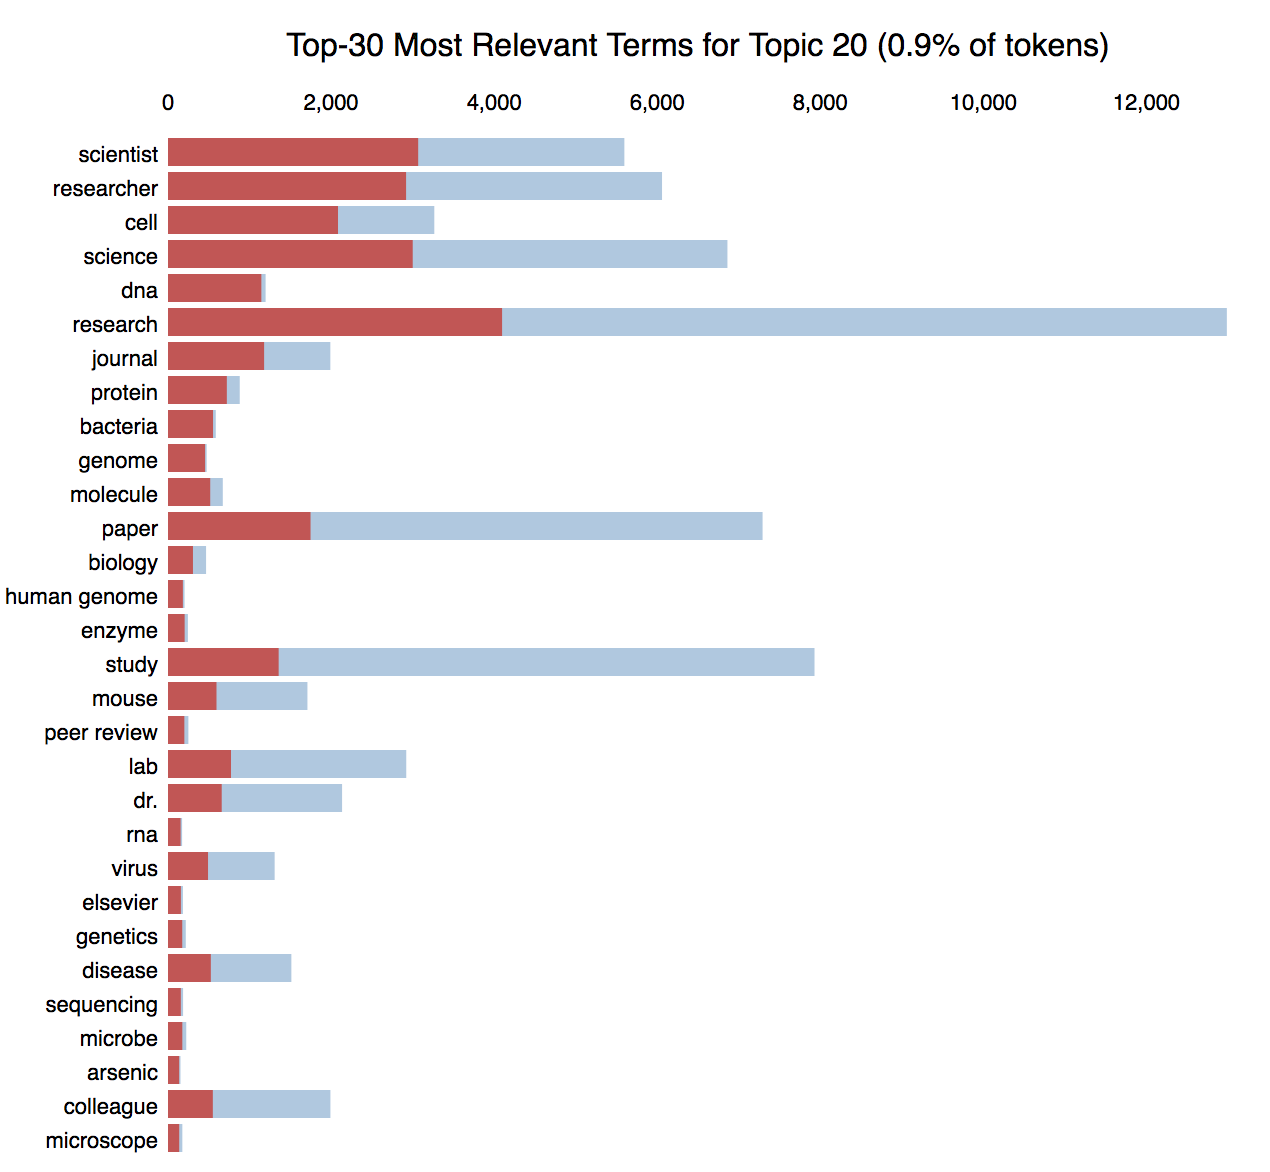
Adapt or extend the FreqDist visualizer to show not just the frequency of tokens in the corpus but rank them according to their relationship to a topic model (e.g. LDA). Ranked by saliency, the FreqDist will show the frequency of the terms that contribute the most information to all topics. Ranked by relevance the FreqDist will show the terms most relevant to a specific topic and the proportion of their frequency in the topic compared to the rest of the corpus. Metric definitions are:
- saliency(term w) = frequency(w) * [sum_t p(t | w) * log(p(t | w)/p(t))] for topics t; see Chuang et. al (2012)
- relevance(term w | topic t) = λ * p(w | t) + (1 - λ) * p(w | t)/p(w); see Sievert & Shirley (2014)
This computation requires a model (so probably our best bet is to extend FreqDist to TopicFreqDist and make it a model visualizer). It also rquires a parameter, lambda.
Is your feature request related to a problem? Please describe. Implementing this will bring YB closer to being able to provide a PyLDAViz-like solution to topic modeling and clustering.
Examples
Here is the FreqDist ranked by saliency to a topic model instead of ranked purely by freqency:
Here is a topic's terms ranked by relevance and compared to the rest of the corpus (e.g. red vs. blue):
I love this suggestion! For those interested, further reading:
- Original R package: LDAvis
- Python port: pyLDAvis
- Latent Dirichlet Allocation
- Topic Modeling
- sklearn.decomposition.LatentDirichletAllocation
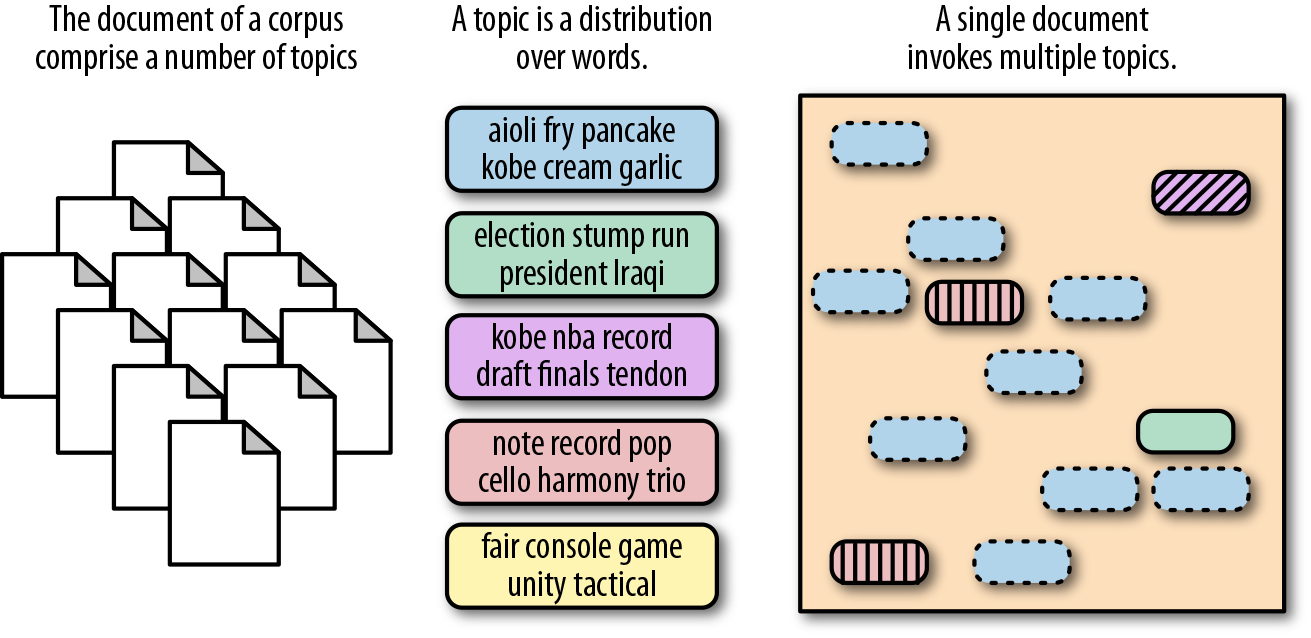 (from Ch 6 of Applied Text Analysis with Python)
Hey guys,
Love the idea. Any progress on it? I want to use it for my current LDA model. :)
Thanks
Hi @hminooei thanks for using Yellowbrick! No progress on it, but we're certainly open for contributions and PRs!