yellowbrick
 yellowbrick copied to clipboard
Published
20 hours ago •
 DistrictDataLabs
Augment Prototype DecisionBoundary Viz with metrics
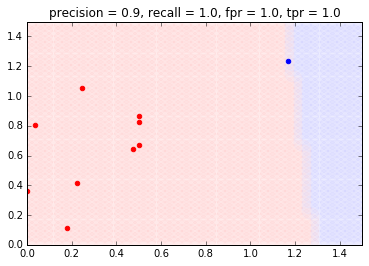
Add labels with metrics such as recall, precision, tpr and etc to the DecisionBoundaryVisualizer
As seen in as the visualizations in this blog post:
https://medium.com/towards-data-science/what-metrics-should-we-use-on-imbalanced-data-set-precision-recall-roc-e2e79252aeba
Example from the blog post: