Error Topology Plot
Implement an error surface/topology plot for MultiModelMixin Visualizer to enable users to visualize how the optimization is working.
For example, we could show with a regression the mean squared error over a range of models.
Hi this seems like an interesting problem but can you provide more context/details. From my understanding it is a plot of the following nature: mse vs regularization constants in the case of Elasticnet regression
@rohit-ganapathy thank you for your interest in this plot! I think you're definitely thinking along the right lines, that this is a hyperparameter tuning or grid search problem; though a single parameter evaluation such as mse vs. regularization can actually be implemented using the ValidationCurve by specifying a different scoring metric and a range of alpha and is even more specifically implemented in the AlphaSelection visualizer.
In this case, I think we were thinking of something more like a 2-parameter optimization in either 2D:
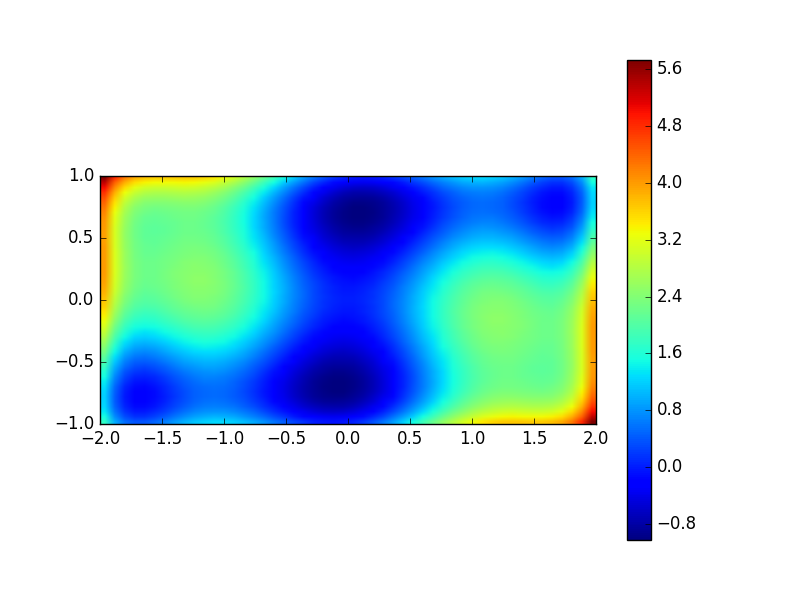
or 3D:
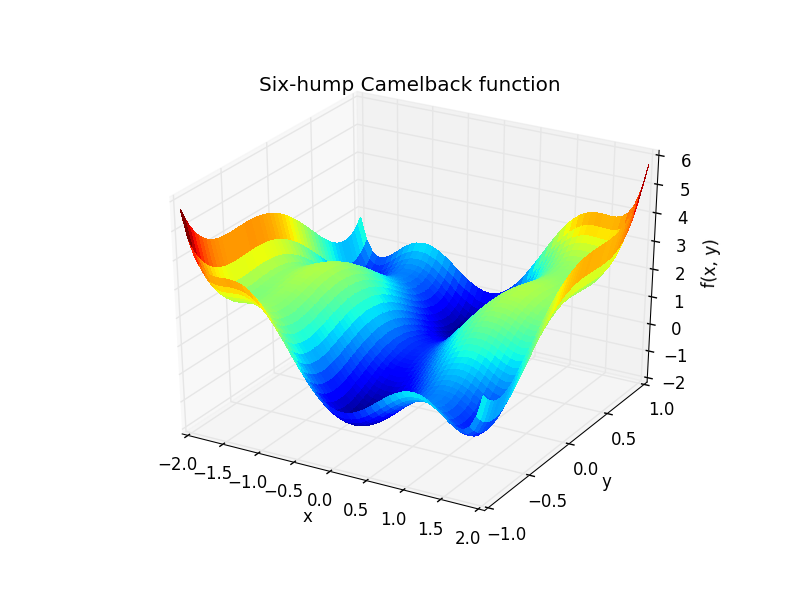
E.g. alpha vs l1_ratio against MSE for ElasticNet.
This by itself would be AWESOME for YB and we'd love to have it. @rebeccabilbro further suggests that we could do this not only for hyperparameters but also for different model realizations if we could find some way to display those realizations in a grid and use color or 3D to visualize the error.