CytoExploreR
 CytoExploreR copied to clipboard
Handling of transformed data with cyto_save() and cyto_load()
Describe the bug Transformation is apparently lost during save and load of gating set.
Expected behavior My expectation is that when I save a gatingSet with cyto_save() and the transform list has been specified by the 'trans = argument' that it will come back in as properly transformed data equivalent to what I created from raw .fcs files in CytoExplorer. The loaded data set should be usable in ggcyto().
** Actual behavior** Apparent bug. [1-works as expected] I load spill correct, and transform a gating set. I create some additional gates which I add to gating set and recompute(gsSamp), I then plot it in ggcyto() including the lines:
  ...
axis_x_inverse_trans() +
axis_y_inverse_trans() +
...
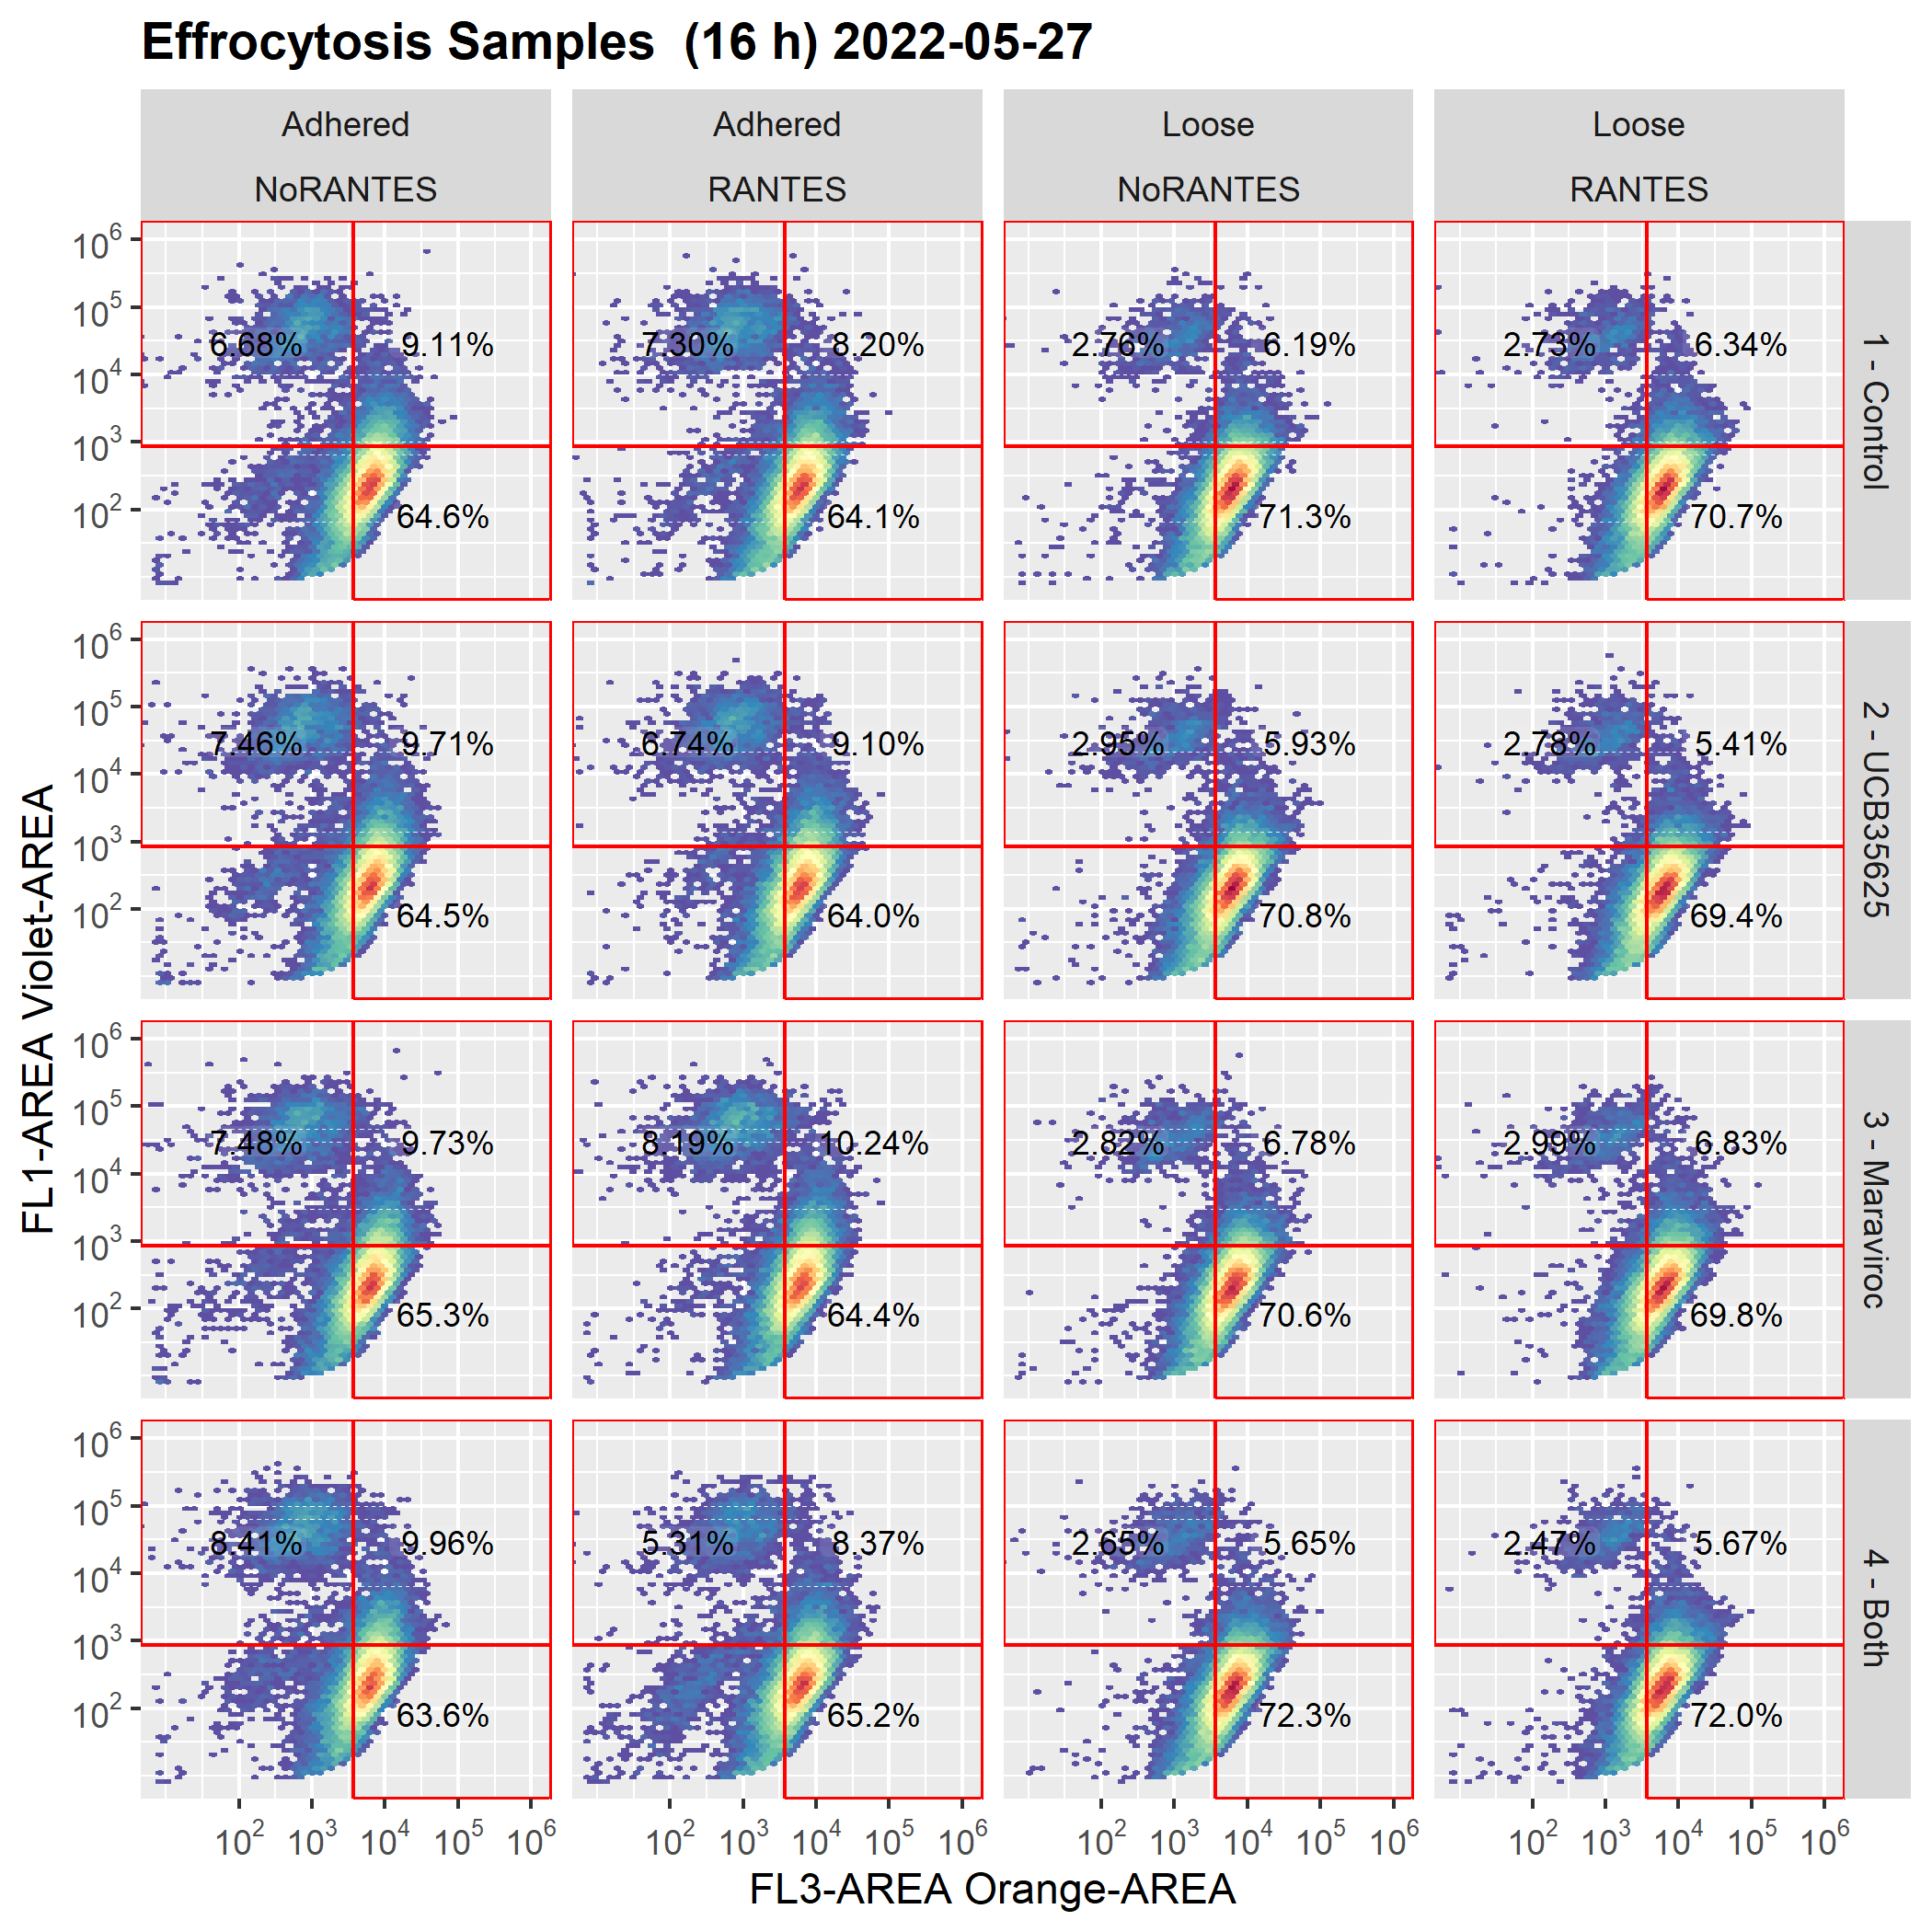
The plot axes are drawn, as expected, in original units.
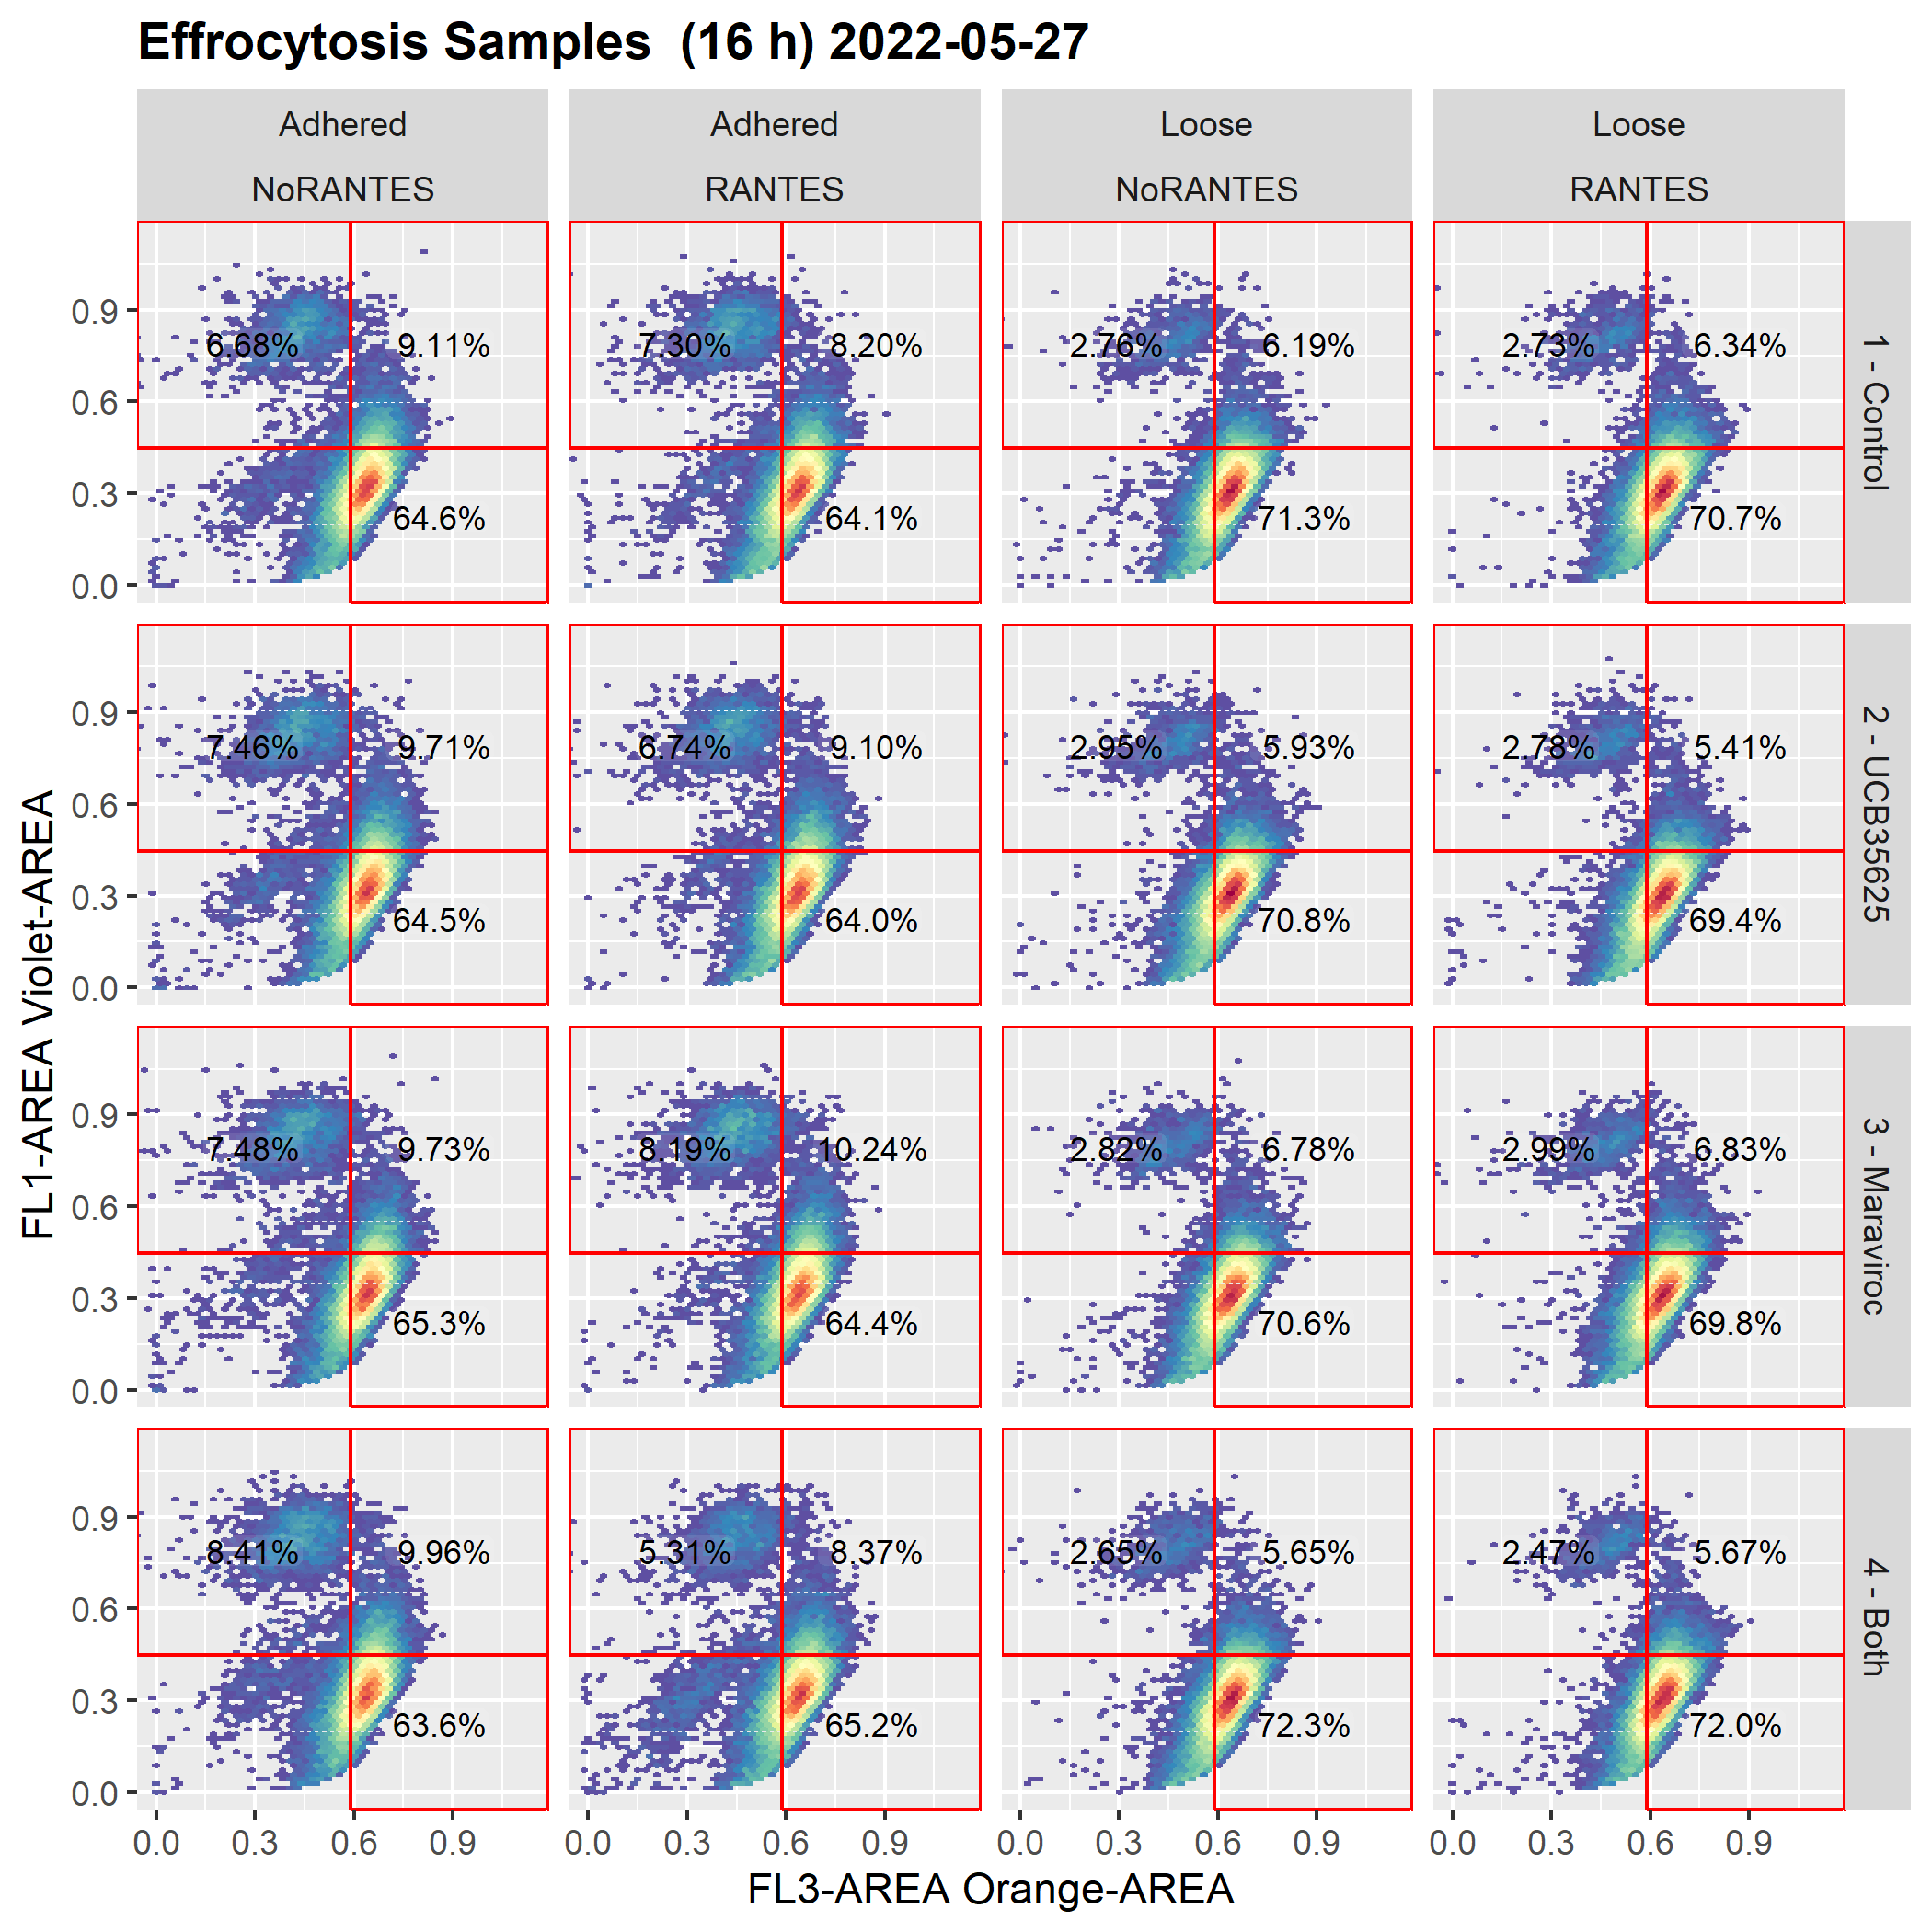
[2- no longer works as expected] I then do a cyto_save(gsSamp, trans = TransList) followed by cyto_load(gsSamp) and plotting the very same plot no longer honors the axis_x_inverse_trans() and axis_x_inverse_trans() functions
Below are the graphs before and after the save/reload
Screenshots
Expected graph (graph as drawn before cyto_save() and cyto_reload():
Graph after cyto_save() and cyto_load()
Additional context - more complete code for the repex
# ---
# cyto_save() and cyto_load  transform handling issue
# ---
eDate = "2022-05-27"
phagDur = "(16 h)"

# Create subdirectories for output in case they don't exist
dir.create(file.path(".", "Figures"), showWarnings = FALSE)
dir.create(file.path(".", "Reports"), showWarnings = FALSE)

# Load the packages we will need
library(readxl)
library(tidyverse)
library(dplyr)    # used for recode() to fix facet order
library(CytoExploreR)
library(openCyto)
library(flowWorkspace)
library(ggcyto)
library(patchwork)

# ========================================================================
#  SAMPLES-
#-------------------------------------------------------------------------
# The sample files for this example are in a subfolder named Samples
getwd()
gsSamp <- cyto_setup(path = "./Samples",
                     gatingTemplate = "Samples-Template.csv",
                     details = "Samples-Details.csv",
                     restrict = TRUE)

# Apply compensation to samples, (spill matrix from spill.r)
gsSamp <- cyto_compensate(gsSamp,
                          spillover = "Spillover-Matrix.csv")

# Translist creation
transList <- cyto_transformer_arcsinh(gsSamp)

# Apply our arcsinh transform for better viewing of our gatingSet
#   [Note: never do this line more than once; start over if in doubt.]
gsSamp = cyto_transform(gsSamp, trans = transList)

# Show us our channels and markers
cyto_channels(gsSamp)
cyto_markers(gsSamp)
cyto_fluor_channels(gsSamp)

# Gate (non-debris) Cells (Samples-Template.csv)
cyto_gate_draw(gsSamp,
               parent = "root",
               alias = "Non-Debris",
               channels = c("FSC-AREA", "SSC-AREA"))

# Gate Single Cells ((Samples-Template.csv))
cyto_gate_draw(gsSamp,
               parent = "Non-Debris",
               alias = "Single Cells",
               channels = c("FSC-AREA", "FSC-HEIGHT"))

# # Gate SytoxAAD on Unstained
# cyto_gate_draw(gsSamp,
#                parent = "Single Cells",
#                alias = c("Live", "Dead"),
#                channels = "FL4-AREA",
#                type = "interval",
#                negate = TRUE)

# This next line is necessary if you are re-using gates from before
cyto_gatingTemplate_apply(gsSamp, "Samples-Template.csv")

# --------------------- End normal gatingSet creation process ----------------------

# Create and apply some gates
# ===================================================================
# Pick out gate cut-off from pure macrophage and melanoma samples
# ===================================================================

# Samples to use as standards
cyto_details(gsSamp)  # figure out where mel and macro standards are (should be 17 & 18)
cyto_details(gsSamp)$name[17]
violetMelSamp = gsSamp[[17]] # Violet Melanoma cells
frBaseMel <- gh_pop_get_data(violetMelSamp, "Single Cells",
                             returnType = "flowFrame")
cyto_details(gsSamp)$name[18]
orangeMacroSamp = gsSamp[[18]] # Orange macrophage cells
frBaseMacro <- gh_pop_get_data(orangeMacroSamp, "Single Cells",
                               returnType = "flowFrame")

# quantileGate - Macrophage (more orange than 99% base melanoma)
orangeChan <- "FL3-AREA"
orangeCut <- openCyto:::.quantileGate(frBaseMel,
                                      channels = orangeChan,
                                      probs = .99)

# quantileGate - Melanoma (more violet than 99.5% base macrophage)
violetChan <- "FL1-AREA"
violetCut <- openCyto:::.quantileGate(frBaseMacro,
                                      channels = violetChan,
                                      probs = .99)

# Add a quad gate
# The quantile results (center point for simple quad gate)
orangeCut@min  # dangerous to directly poll slot
violetCut@min    # dangerous to directly poll slot

qg_man <- quadGate("FL3-AREA" = orangeCut@min, "FL1-AREA" = violetCut@min)
# Add gate defined from controls to all samples
gs_pop_add(gsSamp, qg_man, parent="Single Cells",
           names = c("Bait Cells", "Phagocytosis", "Macrophage", "Unstained"))
gs_pop_get_children(gsSamp, "Single Cells")
recompute(gsSamp, "Single Cells")

# ********** Axis inversion works ******************************
# Fix the plot order a little
ordBlocker = recode(cyto_details(gsSamp)$Blocker,
                    "Control" = "1 - Control",
                    "UCB35625" = "2 - UCB35625",
                    "Maraviroc" = "3 - Maraviroc",
                    "Both" = "4 - Both")

cyto_details(gsSamp)$ordBlocker = ordBlocker
eDate = "2022-05-27"
phagDur = "(16 h)"

# Plot some samples with inverse transform axis
# Plot this manual quad gating approach for Experimental Conditions
samples_p = ggcyto(gsSamp[1:16], aes(x = `FL3-AREA`, y = `FL1-AREA`),
                   limit = "instrument") +
  axis_x_inverse_trans() +
  axis_y_inverse_trans() +
  ggcyto_par_set(limits = "instrument") +
  geom_hex(bins = 64) +
  geom_gate("Bait Cells") +
  geom_stats(gate = "Bait Cells", size = 3, alpha = 0.1) +
  geom_gate("Phagocytosis") +
  geom_stats(gate = "Phagocytosis", size = 3, alpha = 0.1) +
  geom_gate("Macrophage") +
  geom_stats(gate = "Macrophage", size = 3, alpha = 0.1) +
  labs(title = paste("Effrocytosis Samples ", phagDur, eDate)) +
  facet_grid(ordBlocker ~ Adhesion + RANTES)
samples_p
ggsave(filename = "axisWorks.png", width = 7, height = 7, dpi = 300, units = 'in' )
# Save and reload breaks axis inversion
cyto_save(gsSamp, save_as = "gsSamp", trans = transList)
gsSamp = cyto_load(path = "./gsSamp")


# Redraw same graph after save and reload
# Plot this manual quad gating approach for Experimental Conditions
samples_p2 = ggcyto(gsSamp[1:16], aes(x = `FL3-AREA`, y = `FL1-AREA`),
                   limit = "instrument") +
  axis_x_inverse_trans() +
  axis_y_inverse_trans() +
  ggcyto_par_set(limits = "instrument") +
  geom_hex(bins = 64) +
  geom_gate("Bait Cells") +
  geom_stats(gate = "Bait Cells", size = 3, alpha = 0.1) +
  geom_gate("Phagocytosis") +
  geom_stats(gate = "Phagocytosis", size = 3, alpha = 0.1) +
  geom_gate("Macrophage") +
  geom_stats(gate = "Macrophage", size = 3, alpha = 0.1) +
  labs(title = paste("Effrocytosis Samples ", phagDur, eDate)) +
  facet_grid(ordBlocker ~ Adhesion + RANTES)
samples_p2
ggsave(filename = "axisDOESNOTWork.png", width = 7, height = 7, dpi = 300, units = 'in' )
This is a known issue that I have already flagged with the cytoverse team. Hopefully support will be added for this soon.
Thanks @DillonHammill. I have been trying to keep my workflow gatingSet and CytoExploreR-centric, but understanding all the things you take care of for us behind the scenes (and when I might be abusing your assumptions) can get intimidating. Your feedback is very helpful.