Label in bar chart
Hi,
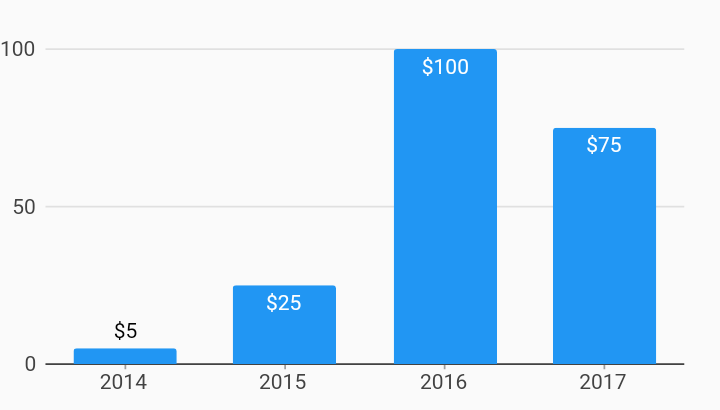
Is it possible to create a bar chart with labels on top of each bar like the example below?
@DavBfr
I tried to add labels by doing inside bar_chart.dart:
context.canvas
    ..drawRect(x, y, width, height)
    ..drawString(
        context.canvas.defaultFont!,
        12,
        value.y.toString(),
        x,
        y + height + 5.0,
    );
It works fine on mobile or when downloading the pdf, but on web when I use PdfPreview the bars are not shown and only labels are visible. Do you have any idea on this?
Am I in right track of implementing the label or should it be implementd some where else?
@838 You're on the right track! Just think of the canvas like a stack, where you put graphic operations, and then apply them: set a color, draw a shape, then fill or stroke the content of the stack. Here you intercalate a text operation between the drawRect and the fillPath operations, that's why some PDF readers will not know what to do. You should move your text drawing to the very bottom of the paint method.
@DavBfr
So far I have created this POC method where it could add a label to the bar chart.
  void _drawLabel(Context context, ChartGrid grid, T value) {
    switch (axis) {
      case Axis.horizontal:
        final y = (grid is CartesianGrid) ? grid.xAxisOffset : 0.0;
        final p = grid.toChart(value.point);
        final x =
            (p.x == double.infinity || p.x.isNaN ? 0.0 + offset + width : p.x + offset - width / 2);
        final height = p.y - y;

        context.canvas
          ..saveContext()
          ..setFillColor(labelColor ?? PdfColors.black)
          ..setTransform(
            Matrix4.identity()..rotate(Vector3(x, y + height, 0), 0.09),
          )
          ..drawString(
            context.canvas.defaultFont!,
            12,
            format?.call(value.y) ?? value.y.toString(),
            x,
            y + height + 5.0,
          )
          ..setFillColor(color)
          ..restoreContext();

        break;
      case Axis.vertical:
        // TODO:
        break;
    }
  }
I try to add an angle option where the label could be rotated on top of the bar, but not sure how should I set the setTransform. Will you please help me with that if you have time? 🙂
Rotation matrix: https://en.wikipedia.org/wiki/Rotation_matrix I'll take a look at this later today.
Something like that:
void _drawLabel(Context context, ChartGrid grid, T value) {
    switch (axis) {
      case Axis.horizontal:
        final y = (grid is CartesianGrid) ? grid.xAxisOffset : 0.0;
        final p = grid.toChart(value.point);
        final x = (p.x == double.infinity || p.x.isNaN
            ? 0.0 + offset + width
            : p.x + offset);
        final height = p.y - y;

        final font = context.canvas.defaultFont!;
        final text = value.y.toString();
        final fontSize = 12.0;
        final angle = pi / 4;

        final metrics = font.stringMetrics(text) * fontSize;

        context.canvas
          ..saveContext()
          ..setFillColor(PdfColors.black)
          ..setTransform(
            Matrix4.identity()
              ..translate(x, y + height + 5.0) // Text position
              ..rotateZ(angle)
              ..translate(-metrics.left, -metrics.top - metrics.height / 2), // Center of Rotation
          )
          ..drawString(
            font,
            fontSize,
            text,
            0,
            0,
          )
          ..restoreContext();

        break;
      case Axis.vertical:
        // TODO:
        break;
    }
  }
You'll have to deal with start, middle or end of the text anchor point for the center of rotation, depending on the angle:
- Angle = 0 => anchor is middle of text
- Angle > 0 => anchor is beginning of text
- Angle < 0 => anchor is end of text
Don't forget the angle returns to zero after +/- 2*pi.
This is a great improvement. It can be added to LineDataSet too It's a bit more difficult though, to not draw on top of the lines.
@DavBfr Thank you so much for your time and great info, I'll continue to work on it 🙂.
This issue is stale because it has been open 30 days with no activity. Remove stale label or comment or this will be closed in 5 days