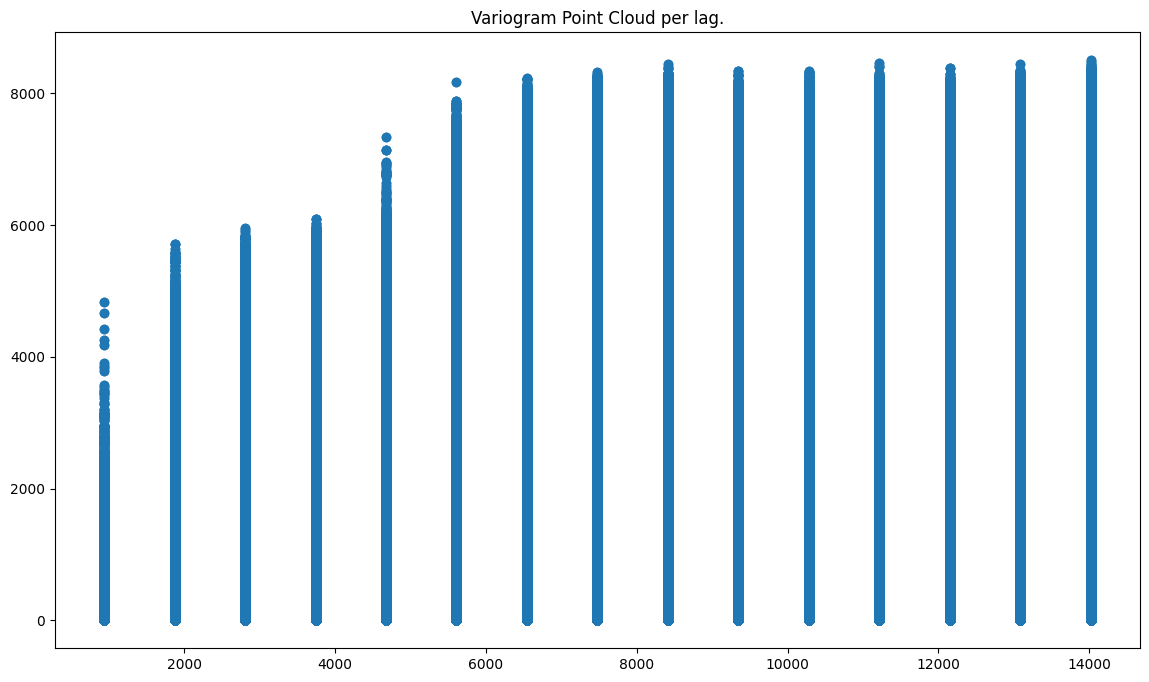
[Variogram Point Cloud] [Scatterplot] Make a swarmplot from the scatterplot of semivariances per lag
Is your feature request related to a problem? Please describe.
Yes, scatterplots generated with matplotlib are ugly and non-informative when we plot categorical data (lags). The example:
More is here: Variogram Point Cloud Tutorial
Describe the solution you'd like The best idea is to create:
- swarmplot - https://stackoverflow.com/questions/36153410/how-to-create-a-swarm-plot-with-matplotlib,
- or slightly disperse points along x axis (do not set them all in a single line) - https://seaborn.pydata.org/tutorial/categorical.html?highlight=bar%20plot#categorical-scatterplots
I would like to avoid seaborn at this moment, and if it is possible to use only matplotlib. If the overhead to create a swarm plot is too high in matplotlib, then use seaborn.
Describe alternatives you've considered n/a
Additional context The exact place in a code where a scatterplot is prepared: https://github.com/DataverseLabs/pyinterpolate/blob/67ca44a4a312850b929309d020fe9f94ea95c61e/pyinterpolate/variogram/empirical/cloud.py#L553
Hi @SimonMolinsky , I am interested in working on this issue. Please assign this to me. Thanks!
Hi @SubinDuresh !
Thank you! If something is not clear, ask here, and I'll respond quickly. If you fork the repo, please make PR into the dev branch later :) I've created a branch for this issue, and you can use it if you want to.
And this task is specific. If you will be forced to write too many lines of code and to perform heavy data processing before plotting, consider using seaborn. I'm not a fan of overengineering :)
Hi @SimonMolinsky I am having trouble testing out the code changes in my local codebase. The code run is taking too long and feels frozen, so I am unable to judge if my code works. Could you suggest a way a to test my changes on my local?
Hi @SubinDuresh ,
I wonder if you use the tutorial linked here? (https://pyinterpolate.readthedocs.io/en/latest/usage/tutorials/Variogram%20Point%20Cloud%20%28Basic%29.html)
If so, this tutorial uses a huge dataset, and scatterplot() of matplotlib renders it very slowly. You can modify it, which take approx. 0.5% of points within a dataset:
import numpy as np

from pyinterpolate import Blocks, read_txt, calc_point_to_point_distance, VariogramCloud
from pyinterpolate.variogram.empirical.experimental_variogram import calculate_semivariance

dem = read_txt('samples/point_data/txt/pl_dem_epsg2180.txt')

# HERE IS THE NEW LINE OR BLOCK

sample_size = int(0.05 * len(dem))
indices = np.random.choice(len(dem), sample_size, replace=False)
dem = dem[indices]
and all other lines are the same. Now it should be much faster :)
It should be the new issue, tutorials should work fast.
Hi @SubinDuresh,
Did you work on this issue? Do you plan to do it? Please let me know, I want to close it soon and I need to know if you had a chance to look into it. If you didn't have time (and don't have it) then let me know too, I will reassign the issue for me ;)
Thanks, Szymon
Hi @SimonMolinsky, really sorry, I've tried working on it but I'm unable to get it to work. Please reassign it. Sorry for the trouble, and thank you!
Regards, Subin Duresh
That is not a problem, thank you for a quick response :) Have a great day,
Szymon