After upgrading to 1.5 and adding rack tracing, I don't see Rack on the list of services
Current behaviour After upgrading to 1.5 and adding rack tracing, I don't see Rack on the list of services
Expected behaviour Rack should appear on the list of services?
Steps to reproduce
Datadog.configure do |c|
  c.tracing.enabled = true
  c.env = Rails.env
  c.agent.port = 8127
  c.tracing.instrument :rails,
                       :service_name => "app_name",
                       :controller_service => "rails-controller",
                       :cache_service => "rails-cache"
  c.tracing.instrument :redis
  c.tracing.instrument :sidekiq
  c.tracing.instrument :http
  c.tracing.instrument :rack,
                       :quantize => {
                         :base => :exclude,
                         :query => :show,
                         :fragment => :show
                       }
  c.telemetry.enabled = false
end
Environment
- ddtrace version: 1.5.0
- Configuration block (
Datadog.configure ...): see above - Ruby version: 3
- Operating system: Ubuntu 20.04
- Relevant library versions: Rails 7.0.4
Can you describe the trace you expect to see? Versus what you are seeing?
My understanding is that you shouldn't see an individual Rack service; services are effectively applications. Rack & Rails are a part of the same application, therefore they should share the same service name.
Also, I don't recommend setting service_name on the Rails configuration, but as c.service = "app_name" instead.
Thanks @delner. I wasn't sure if Rack should show as a service or not.
And thanks for the tip about the service. I'm not sure I understand it though. How do I give our Rails app the service name if I use c.service = "app_name" ? or would it apply to everything?
👋 @gingerlime, ideally, you'd only have to configure one service name for you application and everything would be categorized under that service.
But things get complicated when external services are being measured. For example, when your Rails application calls Redis to retrieve some data, e.g. GET data, a span is created for that Redis call. But the Redis service itself is not part of your application: it's its own external "service".
We call spans that measure external services "peer service spans". It is normally valuable to measure these peer service spans as part of their own services: e.g. spans for a Postgres database, when grouped together, allow you to see how much pressure you application is putting into the database server, especially if such database is shared among multiple services.
By default, ddtrace sets the service name for "peer service spans" to the integration name: e.g. Postgres -> "pg", Redis -> "redis".
Going back to your point, Rack is not an external service, it's an internal part of your application. Before v1.0.0, ddtrace used to tag all spans with their own service name, that matched the integration name (e.g. Rack -> "rack"): this was not a good practice. Most spans are internal to the application, and thus should be considered as part of the main application's service.
In short, all spans that measure behavior internal to your application should have their service name set to the value of the environment variable DD_SERVICE=app_name (or the programmatic equivalent c.service = "app_name"). This is the Datadog standard method for configuring a service's name.
All spans that do not represent internal application behavior CAN be set to a service name that's different from the main application: in case of shared external behavior like databases and caches, it's normally valuable to monitor the database itself separate from the main application.
If your deployments have a very tight resource-to-application relation (e.g. each Rails application has its own Redis, its own Database), you CAN set the service name to the :redis integration to the same a the host application. This way you won't get a separate service page for that specific Redis, but will be able to see it measured correctly (and have access to Datadog metrics) without polluting your Service Catalog.
Thanks for taking the time to explain in such detail, @marcotc. This is super useful.
I'm still a bit unsure what it means in practice however. After changing our config to remove service_name from rails and use c.service = "app_name", I still see a service called active_support-cache for example. Is this really a service? shouldn't it be a part of rails? It's definitely not an external service. Another thing that might or might not be an external service is net/http (not sure what logic applies here to be honest, but I think all net/http calls originate from the rails app / sidekiq).
Side-notes about the service catalog page (I thought it might be helpful since it's still new/beta?):
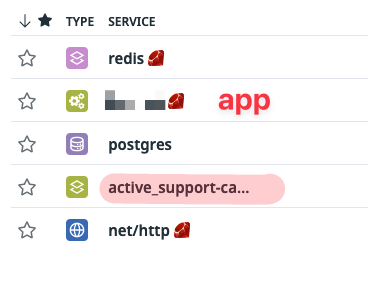
- it won't let me define the time range like the service list page?
- the names can get truncated even though there's space to show the full name
- not sure why the ruby icon applies to some items but not others? both our redis and postgres are used exclusively by the rails app, also active_support-cache is used by rails/ruby
@gingerlime
I still see a service called
active_support-cachefor example. Is this really a service?
Arguably, yes. It's connecting to an external service (e.g. Memcached). If there isn't a child span below that one specifically for the cache library (e.g. redis or dalli) and we attributed it to Rails, it would incorrectly suggest the time spent in the cache service was time spent in the Rails application.
If there is a child span below active_support-cache that measures the cache service, then it may be preferable to have it reflect the Rails service name instead. In which case, the answer may be "no".
This is an edge case: ORMs (like ActiveRecord and ActiveSupport caching) act as "data access layers" to services that are otherwise uninstrumented, but also are actually Ruby components. Classification is tough, but we consider it worse if we attributed database time to application time, so our defaults lean towards breaking out ORMs as their own services instead of the prior.
Unfortunately I don't know much about the UI to explain those behaviors (we're merely data collection). The Ruby icon is likely being applied if the root span for the trace has a language or app tag of ruby, something that we add to our auto-instrumentation. You wouldn't expect this to be tagged on "external service" spans, because those measurements chiefly encompass things that are not Ruby. (See the caveat I described above.)
Thanks again for your patience @delner !
Our ActiveSuppor cache does use redis. How do we make dd-trace "aware" of this connection then?
Our ActiveSupport cache does use redis. How do we make dd-trace "aware" of this connection then?
I wan to make sure I understand you request: do you want your active_support-cache service to be part of your Rails app service? (as opposed to its own separate active_support-cache service?)
If so, you can set the :active_support, cache_service: 'app' value to match your application's name. This should be the default (for active_support's service name match the global c.service) but was one more breaking change for users that we didn't want to tackle on v1.0.