dd-trace-rb
 dd-trace-rb copied to clipboard
[GraphQL] Improve how queries are grouped
Hello 👋
We ❤️ APM tracing, it's helpful and has been very valuable for us, specially the fact that we can connect services together using distributed traces and have a clear picture of the call from user to back of the backend.
As we adopt more GraphQL in our Ruby on Rails services, we noticed that the integration could be modified to embrace the GraphQL mindset and improve our visibility on APM.
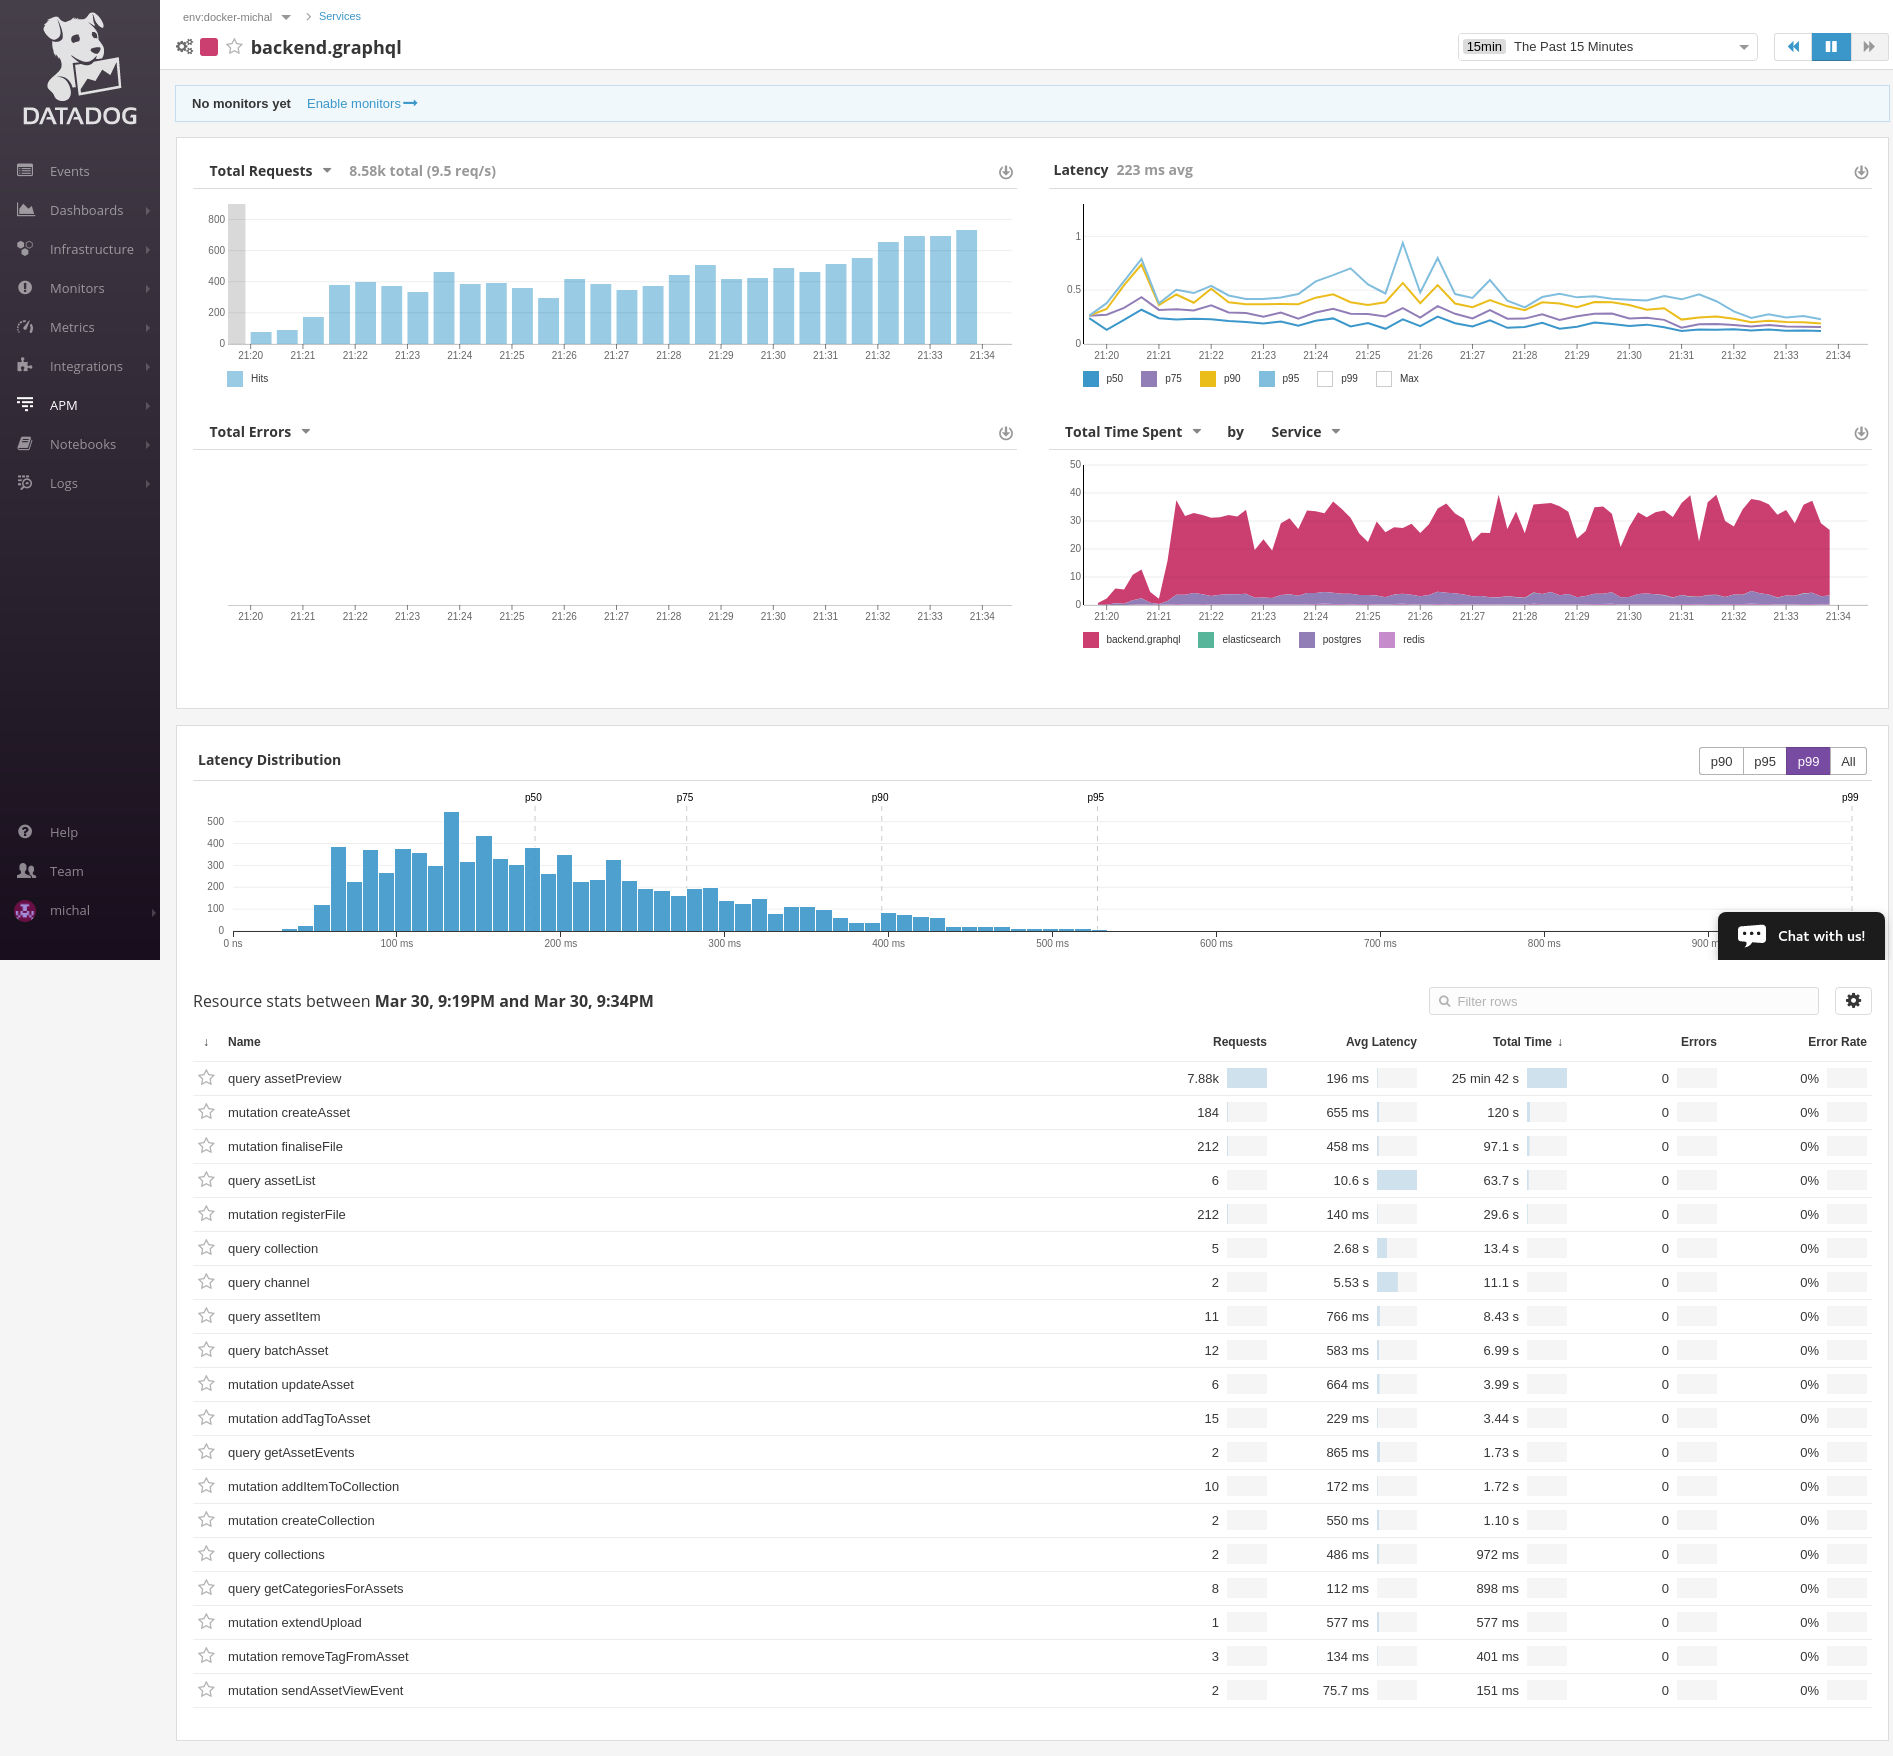
The original way that this gem works by grouping requests by endpoint or controller actions works like a charm for RESTful APIs:

For GraphQL requests is hard to visualize which queries are being executed, for example, from the image above, if we go into GraphQL controller we will see a list of traces, each having distinct execution times and queries, the way to find which query was slow or fast involves inspecting a single trace and finding the correct span that has execute.graphql:

What we would like to have if possible is something similar to the Python tracing from this repo: https://github.com/beezz/ddtrace-graphql
You can see that queries and mutations are grouped separately and at glance one can tell what's slow, fast, popular.
It would help us immensely to be able to see the traces we send categorized like that.
Thank you for considering this feature request. 🙇
Thank you for the detailed suggestion, @cabello.
We've had requests to improve visibility into GraphQL in the past, and I believe your request makes a lot of sense.
When I look into exposing information about the GraphQL query as the top-level resource name, I had a concern and I was wondering if you could help me figure out if it make sense for you, given you are a production user of GraphQL:
- For services that don't exclusively serve GraphQL, you see a mix of
UserController#indexalongsidemutation account, for example. The downside is that it makes the service page entries less consistent, but I believe it's the correct representation.
Overall, I think your request seems straightforward, I'll work with my team to schedule the work required here.
Thank you again!
Hello, what is the status of this issue @marcotc @delner ? We are trying to use Datadog for our graphql API and we have the same issue, that queries and mutations are being hard to find, as I can only see execute.graphql and IntrospectionQuery. We would really appreciate that we could view them as in the Python example from @cabello
Hey @Jandrov : we were doing some work on GraphQL a few months ago, but this particular issue is sidetracked at the moment while we finish our 1.0 release. We will see if we can pick this up again in the near future.
It is worth noting that GraphQL instrumentation is one of the few libraries in which we didn't implement the instrumentation; it exists entirely within the GraphQL repository, not ddtrace. Major structural changes to how the trace looks can only made there, at the moment.
For GraphQL instrumentation Wealthsimple has a good reasonable solution these days, @rperryng could chime in, give suggestions.
@Jandrov as @delner mentioned above, the GraphQL ruby gem is the one that sets up instrumentation of the GraphQL requests. The gem groups resources based on the operation name of the incoming query document - for this reason we ended up creating some middleware that generates and adds an operation name to the incoming query document if it doesn't already have one.
Basically:
- Use a GraphQL visitor to replace argument values in the query document to something static, like the string
"redacted". This helps ensure similar un-named queries generate the same operation name. - Using this "normalized" query document as a string, generate a
SHA256hash from it. - Parse the incoming query document and grab the first name from the operation's selection set (the first field name, ignoring meta fields like
__typenamewhich are usually added by GraphQL clients) - this will help give the generated name something semi-semantic and meaningful to the query. - Use another GraphQL visitor (with the
on_operation_definitionhook) to assign the generated operation name ("#{root_field_name}__#{document_hash}") to the operation definition - Execute the query
This way, we get resources in our GraphQL APM page grouped by the query body. We haven't found there to be a noticeable impact in terms of overhead with this approach. Let me know if this was clear or if there's more detail I could help provide!