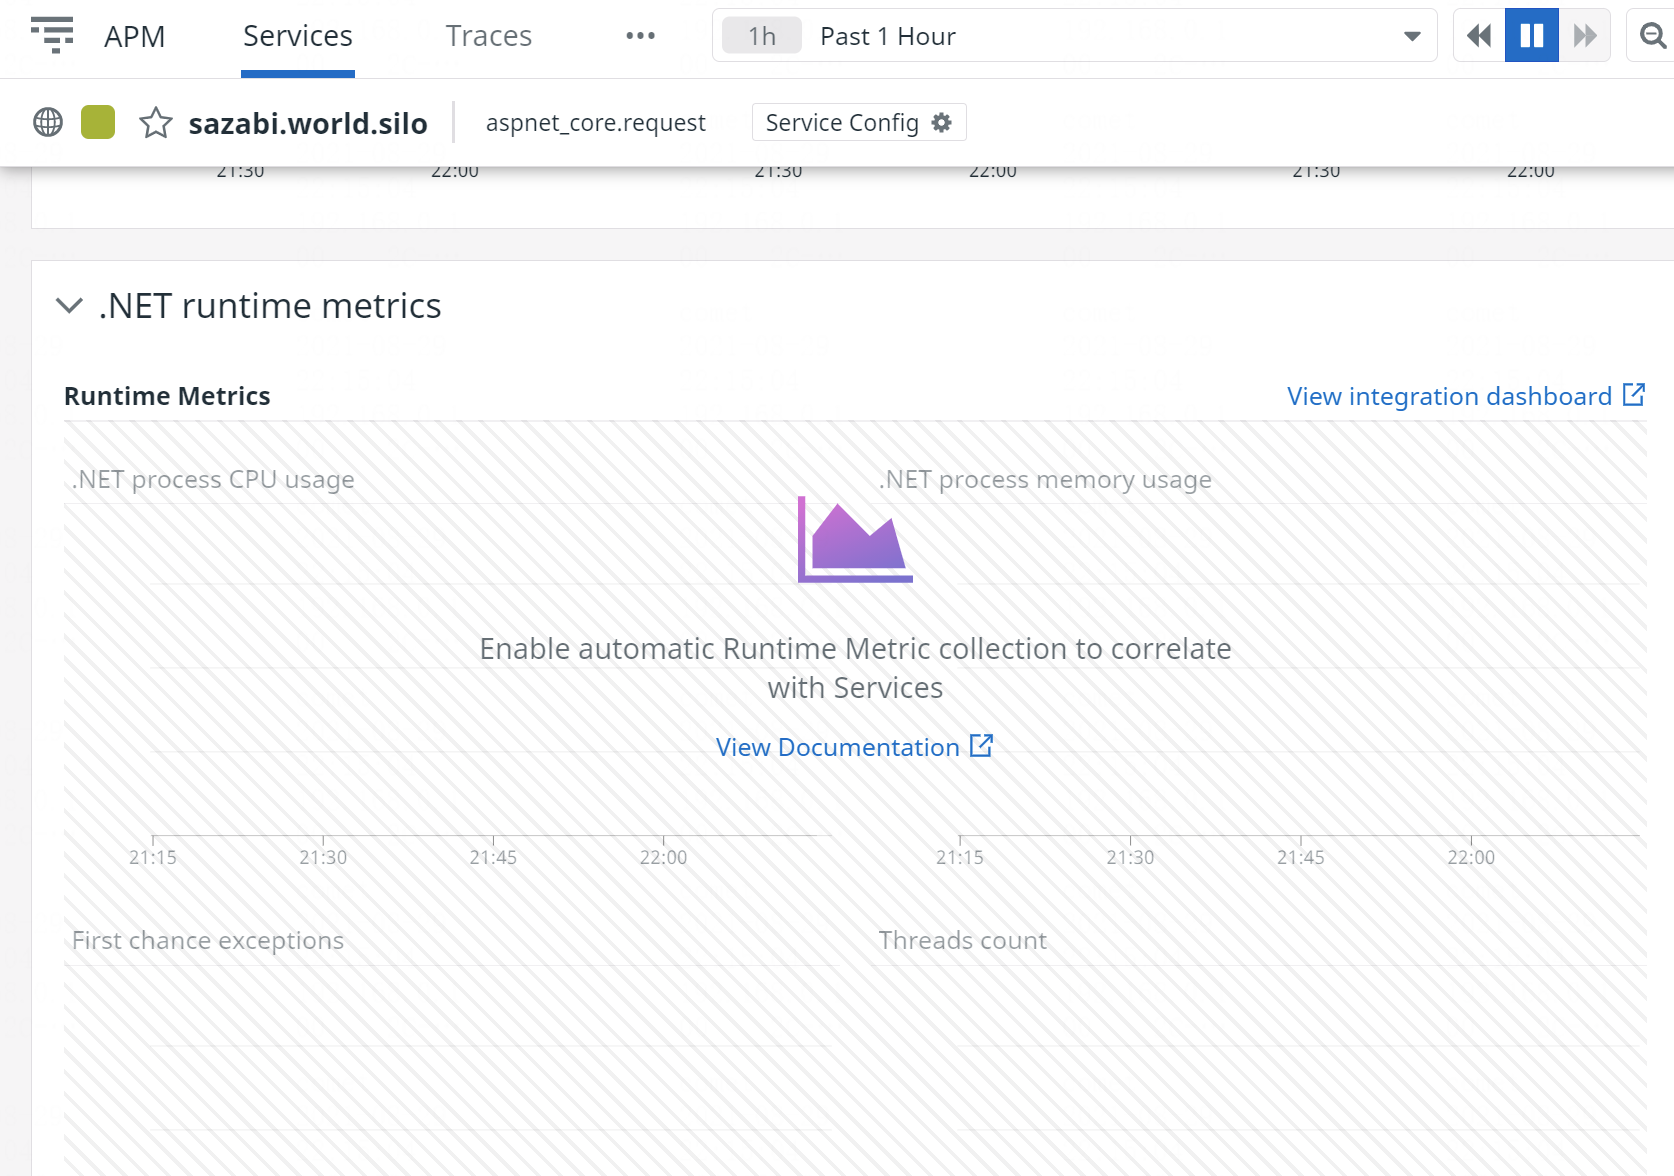
No runtime metrics in .net core service?
Describe the bug I configured datadog agent with dotnet runtime metrics integration, and launch my app with app settings:
{
  "$schema": "http://json.schemastore.org/launchsettings.json",
  "profiles": {
    "Sazabi.World.Silo": {
      "commandName": "Project",
      "environmentVariables": {
        "ASPNETCORE_ENVIRONMENT": "Development",
        "DOTNET_ENVIRONMENT": "Development",
        "CORECLR_ENABLE_PROFILING": "1",
        "DD_RUNTIME_METRICS_ENABLED": "true",
        "CORECLR_PROFILER": "{846F5F1C-F9AE-4B07-969E-05C26BC060D8}"
      }
    }
  }
}
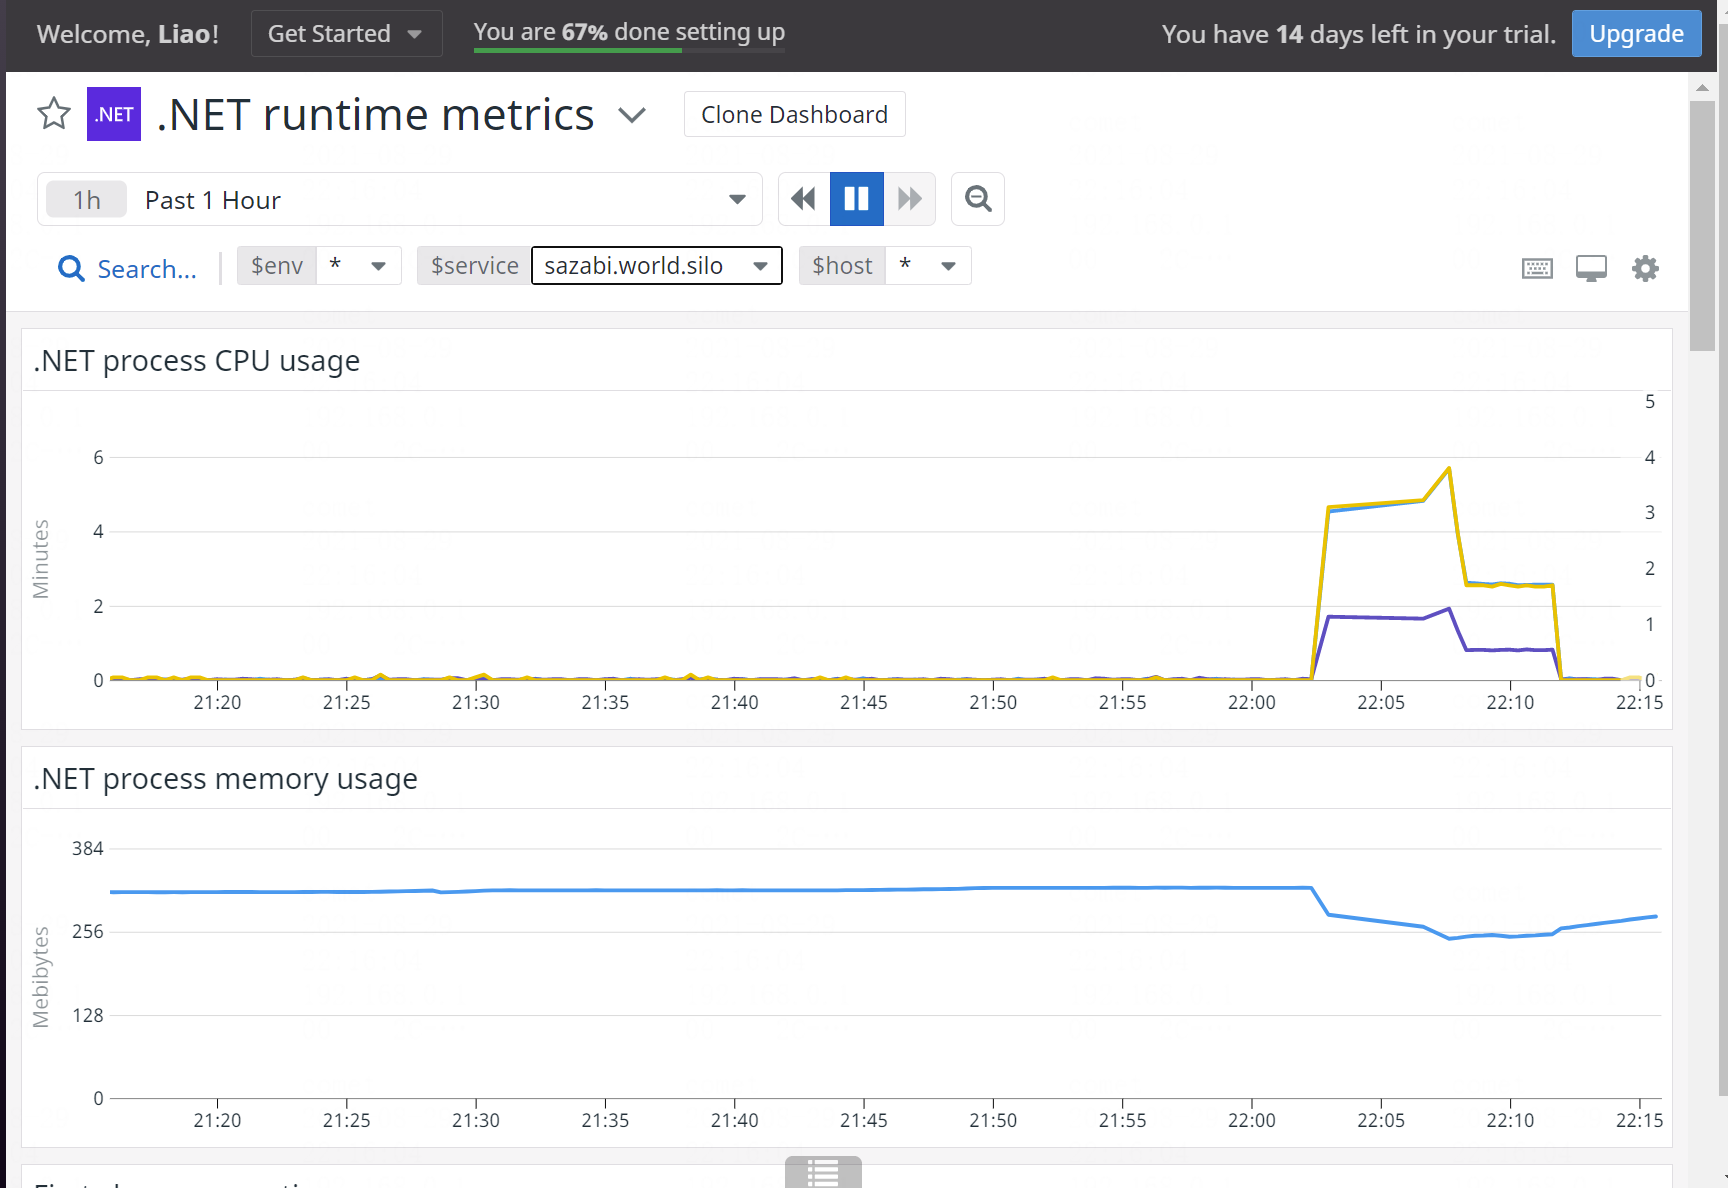
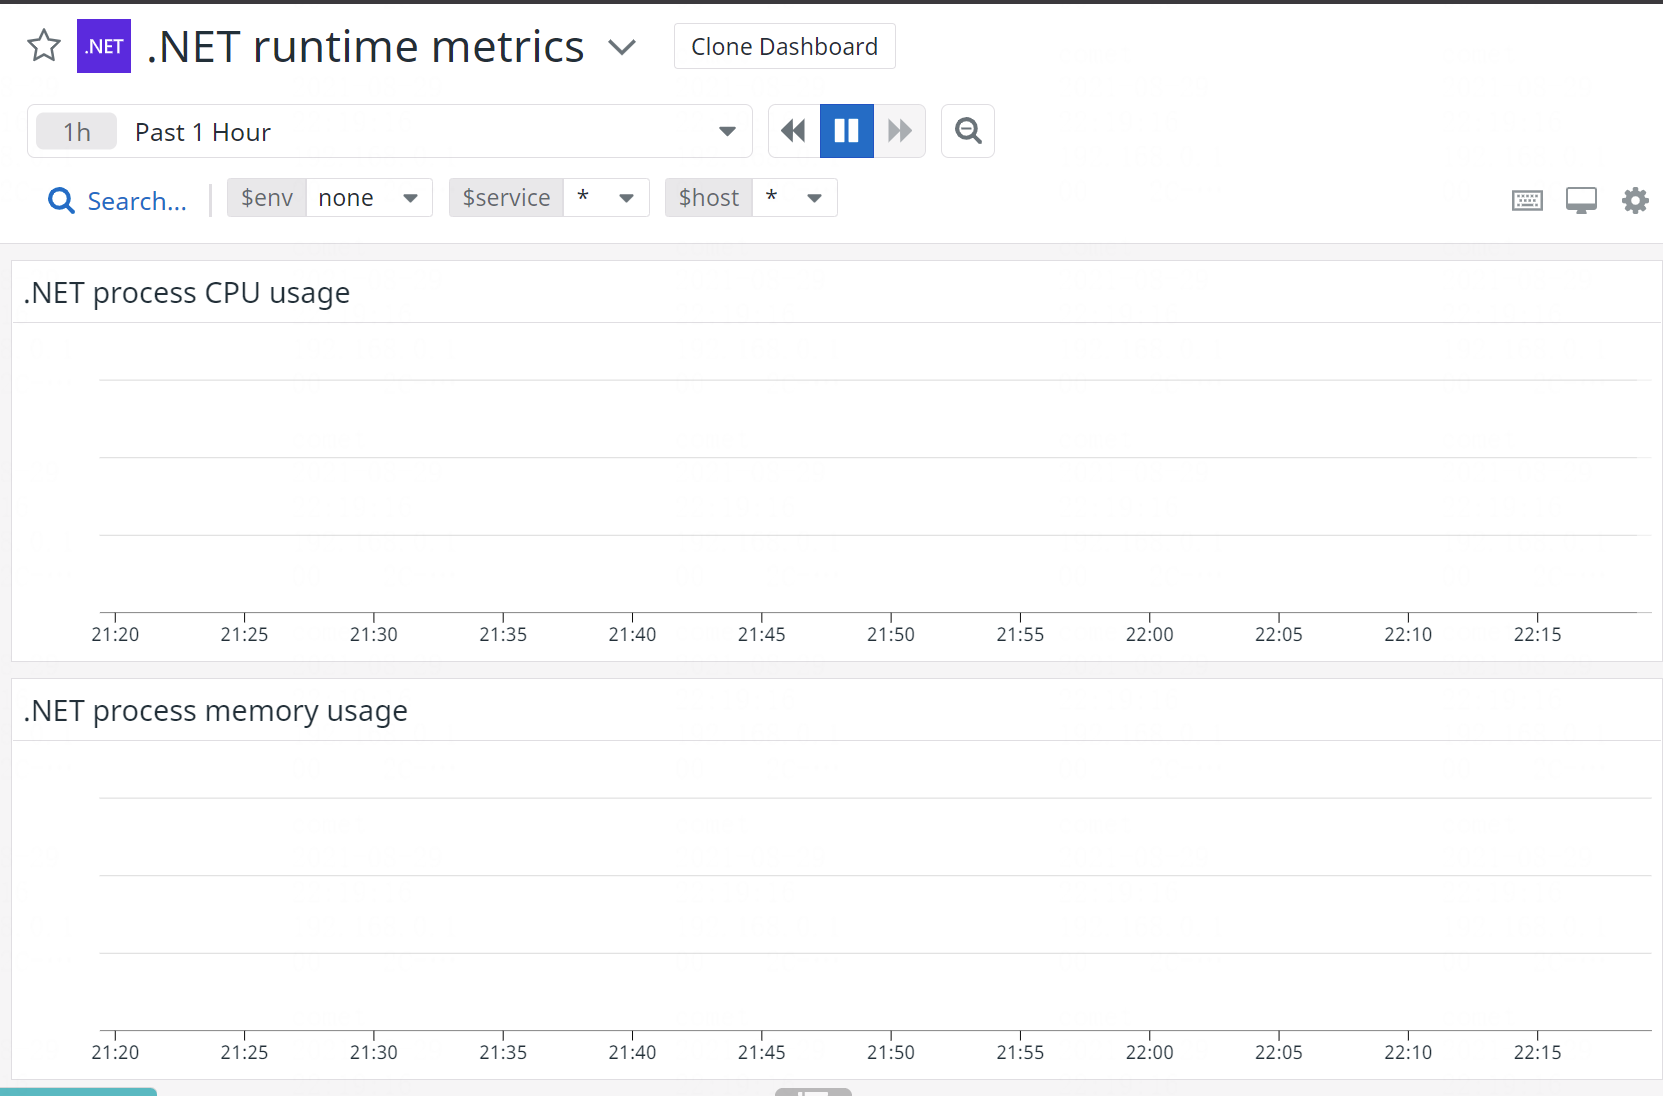
It collects data in dotnet runtime metrics dashboard, but no data is showed in service page. And in the dashboard, metrics are not showed sometimes, unless go back to dashboard list and click the dashboard again.
Screenshots
Runtime environment (please complete the following information):
- Instrumentation mode: [e.g. automatic with msi installer or manual with NuGet package]
- Tracer version: 1.28.2
- OS: Windows 10 Pro
- CLR: .NET 5.0
@vrecluse, please create a support ticket by contacting [email protected] and referencing this GitHub issue. Thank you!
I hope our support team was able to help you get runtime metrics running. Closing this ticket as stale (one year).