First call to external resource very slow if CORECLR_ENABLE_PROFILING=1
Describe the bug We have several microservices on AKS and all have the same problem. After enabling the APM functionality in the dockerfile, the first call to any database or elastic search is super slow. Sometimes we have to wait about 20 seconds. If we disable the profiling, everything is fine. Do we configure something wrong?
The application itself is garanteed to be running. We also have a health/ready endpoint invoked by K8s. And we created a simple endpoint just returing a string. This one is super fast as expected. Only the DB Call is affected.
We have an AKS Cluster with two nodes. Each node has the DataDog Agent installed as a daemon set (with helm chart). On the Test microservice we run the amd64.dev package of the apm client, Version 1.22.0.
Thank you very much for your help!
To Reproduce Steps to reproduce the behavior:
- Create a simple .net Core 3.1 Web Api
- Create a simple GET API and execute any command to a datbase
- Invoke the Endpoint after deploying to K8s
- See the delay in the trace (and even feel it)
Expected behavior We expect to have almost no delay before the actual SQL Query is executed.
Screenshots
Runtime environment:
- Instrumentation mode: automatic
- Tracer version: DataDog APM Package 1.22.0
- OS: Docker Image on AKS with Node Version 1.17.9
- CLR: .NET Core 3.1
Db Call Action
        using Microsoft.Data.SqlClient;

        [HttpGet]
        [Route("db")]
        public async Task<ActionResult<int>> Db([FromServices] IOptions<DataAccessOptions> options, CancellationToken cancellationToken)
        {
            await using (var con = new SqlConnection(options.Value.ConnectionStrings.MyDb))
            {
                await con.OpenAsync();

                using (var command = con.CreateCommand())
                {

                    command.CommandText = "SELECT count(*) FROM RE_AD.final.AdSite";

                    return await command.ExecuteScalarAsync(cancellationToken) as int?;
                }
            }
        }
Our Dockerfile content:
WORKDIR /app

# Copy csproj and restore as distinct layers
COPY . ./
RUN dotnet restore

# Copy everything else and build
RUN dotnet publish -c Release -o out

# Build runtime image
FROM mcr.microsoft.com/dotnet/core/aspnet:3.1
WORKDIR /app
COPY --from=build-env /app/out .

# Install Datadog APM
RUN curl -LO https://github.com/DataDog/dd-trace-dotnet/releases/download/v1.22.0/datadog-dotnet-apm_1.22.0_amd64.deb
RUN dpkg -i ./datadog-dotnet-apm_1.22.0_amd64.deb
RUN rm ./datadog-dotnet-apm_1.22.0_amd64.deb

ENV CORECLR_ENABLE_PROFILING=1
ENV CORECLR_PROFILER={846F5F1C-F9AE-4B07-969E-05C26BC060D8}
ENV CORECLR_PROFILER_PATH=/opt/datadog/Datadog.Trace.ClrProfiler.Native.so
ENV DD_INTEGRATIONS=/opt/datadog/integrations.json
ENV DD_DOTNET_TRACER_HOME=/opt/datadog
ENV DD_TRACE_ANALYTICS_ENABLED=true
ENV DD_TRACE_DEBUG=true
ENV DD_LOGS_INJECTION=true

ENTRYPOINT ["dotnet", "Examples.WebApi.Host.dll"]
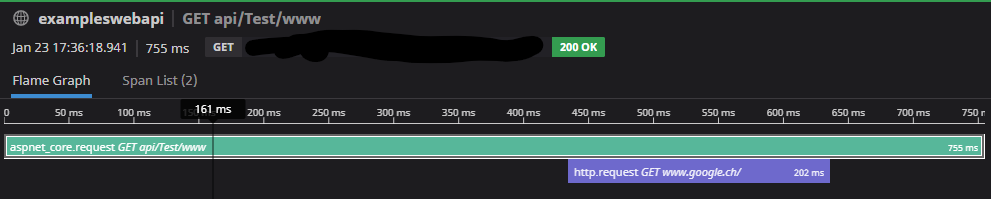
Interesting is, that the delay for a call with a HTTP Client is as expected, less than a second:
        [HttpGet]
        [Route("www")]
        public async Task<ActionResult<int>> Www([FromServices] IHttpClientFactory httpClientFactory, CancellationToken cancellationToken)
        {
            var client = httpClientFactory.CreateClient();

            var result = await client.GetAsync("http://www.google.ch", cancellationToken);
            return (int)result.StatusCode;
        }
Hi @devbrains-com
Thanks for the report.
I noticed you have DD_TRACE_DEBUG set to true. We only recommend doing this for troubleshooting purposes as it triggers verbose logging which can greatly affect startup time.
Do you have this same delay when you disable that setting?
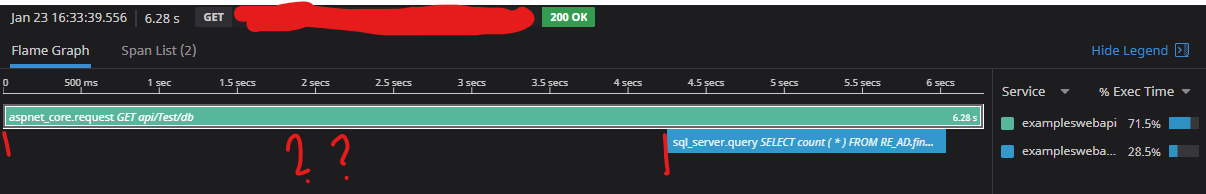
Hi @colin-higgins Thanks for your quick answer. This flag was enabled during our intense testing about this case. Unfortunately, it does not improve the result as you can see on the screenshot.
I added some custom spans and it shows, that the con.OpenAsync() is the slow part. For every different connection, it takes again several seconds for the first time. What's happening during that process on the DD APM side?
I also tried to disable the AdoNet integration, but without luck.
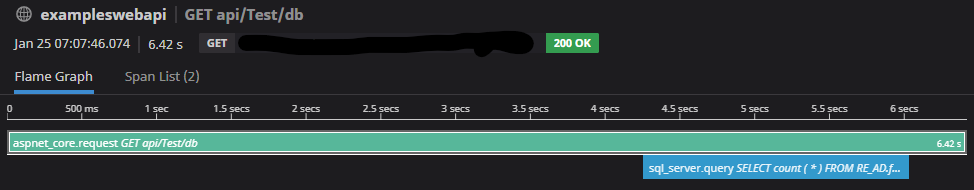
Disabling the CORECLR_ENABLE_PROFILING gets rid of the problems. First OpenAsync() is about 400ms
Enabling the CORECLR_ENABLE_PROFILING slows down everything: First OpenAsync() is about 3000ms (3 Seconds!)
This affects our production environment in a very negative way, as after every release the system lags for some seconds. Sometimes up to 10 seconds. As we have a lot of microservices and about 2 to 5 different db connections per service, this is unacceptable.
Are we doing anything wrong? Or is it just how the system works?
If you need any information or help from my side to solve this, please let me know.
Thank you very much
I also experience a similar behavior in docker containers with SQL client (.net 5, dd-trace-dotnet 1.22.0). Is there a way to figure out/measure the overhead of datadog tracing?
We are also experiencing the same thing on Elastic Beanstalk . We have asp.net core 3.1.6 running with the dd-trace-dotnet 1.22.0 and datadog agent 7. Requests that usually take no more than 1sec go to 5+ seconds . Any update on this ?
Hey everyone, thank you for the reports. It is normal that the very first request will be slower than subsequent ones, but as you mention @devbrains-com, it is longer than expected for your SQL calls. I'll update here as we discover more.
The next release (hopefully shipping early next week) should significantly improve the startup time on Linux. I hope it will be enough to meet your requirements.
1.24.0 is out: https://github.com/DataDog/dd-trace-dotnet/releases/tag/v1.24.0
Please give it a try when you have a chance and tell us if it fixed your issue.
Hey @devbrains-com and @vadimi Have either of you had the chance to verify this?
@colin-higgins yes, I'm on version 1.27.0 and the first request is still slow.
Hello @vadimi, we've kept working on improving our startup performances. The 2.0 version of the tracer, improved the startup performances, especially on Linux. It comes with a few breaking changes in custom instrumentation, but could you upgrade to the latest version and update us on the impacts on your end please? Thank you.
@pierotibou we've moved to version 2.1.0 of the tracer. It seems like it works just a bit faster:

Closing this issue as there hasn't been any activity for a while. If you are still having this problem, please open a support ticket by contacting [email protected]. Thanks!