Setting datadogMonitor.enabled: true in the helm chart doesn't change the arg value to true
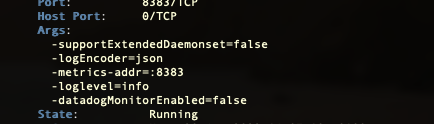
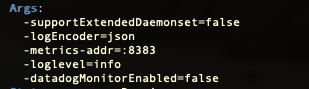
Output of the info page (if this is a bug)
│     Args:                                                                                                                                                                             │                │
│       -supportExtendedDaemonset=false                                                                                                                                                 │                │
│       -logEncoder=json                                                                                                                                                                │                │
│       -metrics-addr=:8383                                                                                                                                                             │                │
│       -loglevel=info                                                                                                                                                                  │                │
│       -datadogMonitorEnabled=false
Describe what happened:
Setting datadogMonitor.enabled: true in the helm chart doesn't change the arg value to true. Meaning that the monitoring isn't actually enabled.
Describe what you expected:
Expected the arg to change to true, so that I can create the DatadogMonitor(s)
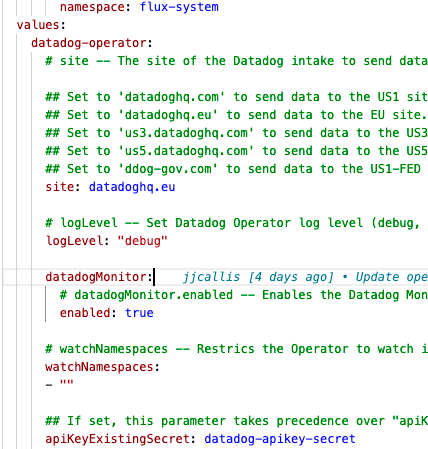
Steps to reproduce the issue: Use this helm chart version 0.8.2: https://artifacthub.io/packages/helm/datadog/datadog-operator set
   datadogMonitor:
        # datadogMonitor.enabled -- Enables the Datadog Monitor controller
        enabled: true
full chart with kustomize*
apiVersion: helm.toolkit.fluxcd.io/v2beta1
kind: HelmRelease
metadata:
  name: datadog-operator
  namespace: flux-system
spec:
  install:
    remediation:
      retries: 3
  upgrade:
    remediation:
      retries: 3
  interval: 30m
  chart:
    spec:
      chart: datadog-operator
      version: 0.8.2
      sourceRef:
        kind: HelmRepository
        name: datadog
        namespace: flux-system
  values:
    datadog-operator:
      # site -- The site of the Datadog intake to send data to (documentation: https://docs.datadoghq.com/getting_started/site/)

      ## Set to 'datadoghq.com' to send data to the US1 site (default).
      ## Set to 'datadoghq.eu' to send data to the EU site.
      ## Set to 'us3.datadoghq.com' to send data to the US3 site.
      ## Set to 'us5.datadoghq.com' to send data to the US5 site.
      ## Set to 'ddog-gov.com' to send data to the US1-FED site.
      site: datadoghq.eu

      # logLevel -- Set Datadog Operator log level (debug, info, error, panic, fatal)
      logLevel: "debug"

      datadogMonitor:
        # datadogMonitor.enabled -- Enables the Datadog Monitor controller
        enabled: true

      # watchNamespaces -- Restrics the Operator to watch its managed resources on specific namespaces
      watchNamespaces:
      - ""

      ## If set, this parameter takes precedence over "apiKey".
      apiKeyExistingSecret: datadog-apikey-secret
      env:
      - name: DATADOG_HOST
        value: "https://api.datadoghq.eu"
Describe the pod kubectl describe datadogmonitor datadog-monitor-test -n flux-system you will notice that the args is false.
Additional environment details (Operating System, Cloud provider, etc):
Kubernetes 1.21 AWS EKS
@jjcallis The Datadog Operator is still in public beta, which I suppose is a valid excuse for the docs being hopelessly outdated/incorrect.
I just ran into this and had to set datadogMonitor.enabled AND datadog-crds.crds.datadogMonitors: https://github.com/DataDog/helm-charts/tree/main/charts/datadog-operator#values
  set {
    name  = "datadog-crds.crds.datadogMonitors"
    value = "true"
  }
  set {
    name  = "datadogMonitor.enabled"
    value = "true"
  }
Why are there two values for the same thing? Who knows.
@jjcallis The Datadog Operator is still in public beta, which I suppose is a valid excuse for the docs being hopelessly outdated/incorrect.
I just ran into this and had to set
datadogMonitor.enabledANDdatadog-crds.crds.datadogMonitors: https://github.com/DataDog/helm-charts/tree/main/charts/datadog-operator#valuesset { name = "datadog-crds.crds.datadogMonitors" value = "true" } set { name = "datadogMonitor.enabled" value = "true" }Why are there two values for the same thing? Who knows.
Appreciate the message @red8888 :) Did it create the monitor in Datadog from the Datadog Monitor?
I've set the following and still no luck on my end.
This is the helm chart
apiVersion: helm.toolkit.fluxcd.io/v2beta1
kind: HelmRelease
metadata:
  name: datadog-operator
  namespace: flux-system
spec:
  install:
    remediation:
      retries: 3
  upgrade:
    remediation:
      retries: 3
  interval: 30m
  chart:
    spec:
      chart: datadog-operator
      version: 0.8.3
      sourceRef:
        kind: HelmRepository
        name: datadog
        namespace: flux-system
  values:
    datadog-operator:
      # site -- The site of the Datadog intake to send data to (documentation: https://docs.datadoghq.com/getting_started/site/)

      ## Set to 'datadoghq.com' to send data to the US1 site (default).
      ## Set to 'datadoghq.eu' to send data to the EU site.
      ## Set to 'us3.datadoghq.com' to send data to the US3 site.
      ## Set to 'us5.datadoghq.com' to send data to the US5 site.
      ## Set to 'ddog-gov.com' to send data to the US1-FED site.
      site: datadoghq.eu

      env:
      - name: DD_SITE
        value: "https://datadoghq.eu"
      - name: DATADOG_MONITOR
        value: "true"

      # logLevel -- Set Datadog Operator log level (debug, info, error, panic, fatal)
      logLevel: "debug"

      datadog-crds:
        crds:
          # datadog-crds.crds.datadogAgents -- Set to true to deploy the DatadogAgents CRD
          datadogAgents: true
          # datadog-crds.crds.datadogMetrics -- Set to true to deploy the DatadogMetrics CRD
          datadogMetrics: true
          # datadog-crds.crds.datadogMonitors -- Set to true to deploy the DatadogMonitors CRD
          datadogMonitors: true


      datadogMonitor:
        # datadogMonitor.enabled -- Enables the Datadog Monitor controller
        enabled: "true"

      # watchNamespaces -- Restrics the Operator to watch its managed resources on specific namespaces
      watchNamespaces:
      - ""

      ## If set, this parameter takes precedence over "apiKey".
      apiKeyExistingSecret: datadog-apikey-monitor-secret
and the example monitor
apiVersion: datadoghq.com/v1alpha1
kind: DatadogMonitor
metadata:
  name: datadog-monitor-test
  namespace: flux-system
spec:
  query: "avg(last_10m):avg:system.disk.in_use{*} by {host} > 0.1"
  type: "metric alert"
  name: "Test monitor made from DatadogMonitor"
  message: "We are running out of disk space!"
  tags:
    - "test:datadog"
Expected it to create the monitor in Datadog, but a bust!